Sea level to rise significantly
It is not just in Australia itself where climate change is leading to a rise in the mean sea level. Under particular threat are low-lying island nations in Oceania, such as atolls with no higher ground as alternative living space. The rise in the mean sea level is directly attributable to two main causes: thermal expansion of the warming water and the melting of onland ice sheets and glaciers.
Anthropogenic warming is accelerating this rise. For example, the global mean sea level increased by an average of 1.7 mm a year between 1901 and 2010. However, looking only at the recent years 1993 to 2013, the rate of rise was already 3.2 mm a year. The mean along Australia's coastlines is similarly high, at 3.1 mm per year; for New Zealand it is 2.1 mm per year. Much greater increases were reported for the coastlines of islands in Oceania, such as Tuvalu. However, natural climate variability may also be a contributing factor in this case,
If greenhouse gases in the atmosphere continue to increase as they have in past decades – roughly in line with what is known as the RCP8.5 "business-as-usual" scenario – global mean sea level can be expected to rise by 84 cm by the end of the century, with an uncertainty range of 61 to 110 cm. Similar results for climate change in Australia have been obtained from modelling projections for the coastlines of Australia and New Zealand.
This sea level rise will intensify coastal erosion. Storm surges and waves could cause more damage to coastlines, port facilities and exposed infrastructure as early as in the next few decades. Depending on the topography, in the long term it will be necessary to consider armouring, elevating or abandoning certain structures. Such adaptations are inevitable and will pose major challenges to addressing climate change in Australia.

Changes in severe thunderstorms
According to a current study, severe thunderstorms are likely to increase, especially in the northern and eastern regions (Allen et al., 2014). For the major cities, the study predicts a considerable increase in the frequency of severe thunderstorm days by the end of the century (2079–2099): a 14% increase for Brisbane, 22% for Melbourne and 30% for Sydney. In contrast, moderate declines are likely to occur in Western Australia, for example in the central wheat belt.
Increased supply of moisture in the atmosphere in coastal regions in particular contributes to the increased frequency of conditions conducive to thunderstorm development. The increased moisture comes from the warmer and more strongly evaporating ocean surfaces. This projected development is based on a scenario that involves substantial rises in CO2 emissions in the future (A2, IPCC SRES, 2000), meaning a continuation of the current business-as-usual trend.
More intense tropical cyclones
ropical cyclones can impact the coastlines of Western Australia, the Northern Territory, Queensland and occasionally northern NSW most usually between November and April. The number of storms observed in the period from 1981/82 to 2012/13 shows a declining trend, which is likely to continue. For instance, current climate model projections under the RCP8.5 scenario up to the end of the 21st century show a continued decrease in the frequency of tropical cyclones. This applies to both northwestern and northeastern Australia, and to the surrounding ocean.
In the northeast, the total number of tropical cyclones could decline by 15 to 35%. However, this decrease only relates to those of minor and moderate intensity, which dictate the trend for the total number of storms. In contrast to the decrease in the total, a rising trend is on the cards for the smaller sub-set of severe tropical cyclones.

Higher precipitation levels near the eye of a storm
What is more, projections indicate that higher precipitation levels must in future be expected within a tropical cyclone. These changes will most likely increase the insured risk arising from cyclones, as rainfall causes damage through water ingress, stormwater and riverine flooding.
Another important aspect is that according to projections, a higher number of storms will advance further south. As a result, the threat to Brisbane (27°S) and the high exposure of the Sunshine Coast and Gold Coast will increase.
Circulation changes and less rainfall in the south of Australia
Observations and climate models show that atmospheric circulation patterns are changing: the tropics are expanding polewards under the effects of continued climate change; the subtropical high pressure zone is also expanding polewards and intensificating.
On account of this shift, the westerly-wind corridor south of the subtropical high-pressure belt is also shifting further polewards. Low pressure systems in this area with weather fronts move from west to east and will (still) reach southern Australia as well as Tasmania and New Zealand, but with reduced frequency.
Decrease in rainfall totals
Circulation changes are leading to the decrease in precipitation totals already observed in the past – since the 1970s in the southwest and since the mid-1990s in the southeast of Australia. In the cool season from April to September, the decrease (averaged for the entire south) is in the range of 10 to 20%. In several southwestern regions, precipitation totals for the last 50 years have decreased by as much as 40%.
While events like the Millennium Drought (1995–2010) and the current drought in the southeast of Australia are caused in part by natural climate variability, such as the non-occurrence of the negative phases of the Indian Ocean Dipole since the mid-1990s, developments in the south overall cannot be explained without factoring in the changes in the circulation systems described above, which are likely attributable to anthropogenic climate change. The subtropical high-pressure belt extending farther to the south plays a central role. Because of it, weather fronts of the southern west-wind zone that bring rain have less of an influence on the southern regions of Australia during the cool season.
East Coasts lows may become less frequent but more intense
According to current climate models, these developments will continue to progress. The frequency of so-called cut-off lows will probably decline overall as a result. These are rain-laden lows that are cut off from the westerly current in the south, and therefore slowed in their west-east movement.
On the east coast, “East Coast Lows” are responsible for most of the precipitation in the southeast, particularly for the proportion of extreme precipitation. Even if, as projected, these systems develop less frequently in the future, recent studies show that the frequency of intense East Coast Lows could increase as a result of climate change in Australia.
The projections result in the following general situation: precipitation totals for the cool season will decrease by 20 to 40% in southern Australia, particularly in southwest Victoria and west Tasmania, but also – in the event of severe climate change (RCP8.5 scenario) – in eastern Australia. No clear changes in precipitation are projected for the tropical north or the rangelands.
Increasing flooding hazard
The area of Australia exposed to extreme precipitation has expanded by 50% since the 1990s. This entire region sees days with precipitation levels that are among the top 10% in the country, based on the daily precipitation distribution. Although mean precipitation totals are decreasing in the eastern and southern regions, climate models project a further increase in heavy precipitation for Australia as a whole.
The expected extent can be illustrated by taking a look at extremely rainy years with a recurrence interval of 20 years, which can contribute significantly to major flood events. By the end of the century, an approximately 25% increase in the amount of rainfall is expected for these 20-year events in southern and eastern Australia, based on the period from 1986 to 2005 (RCP8.5).
The projected increases for northern Australia and the rangelands are slightly lower, and involve a high degree of uncertainty in some cases. Consequently, the flood risk will continue to rise in the future, not least because very intense East Coast Lows or severe thunderstorms are likely to increase in the east and north.
Extreme drought events on the rise in Australia
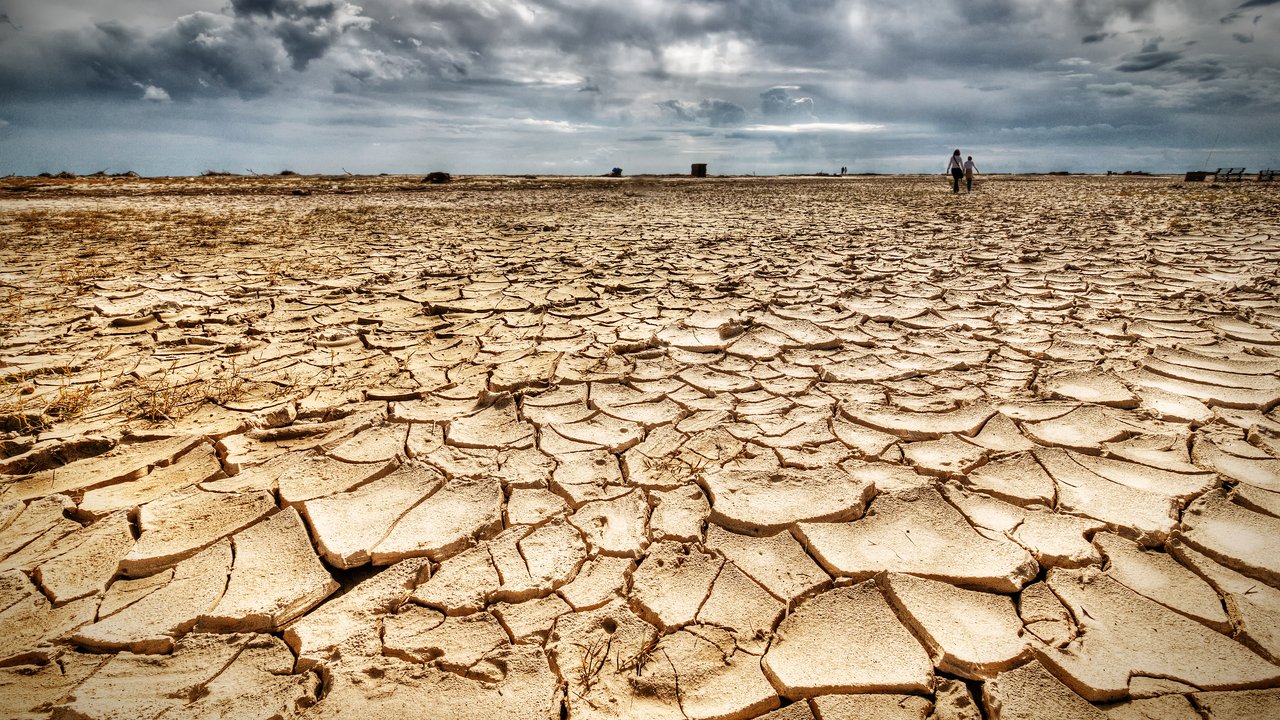
The changes in the circulation systems lead to the above-mentioned decrease in mean precipitation in the southern and eastern regions, and to an increase in mean temperature. In the RCP8.5 scenario, the percentage of time spent in drought conditions will therefore increase by up to 20% by the end of the century.
Although the models predict a decrease in both drought frequency (number of drought events per 20-year period) and drought duration for moderate and severe droughts, they simultaneously show a sharp increase in extreme drought events. This shift in intensity will already be evident by the 2030s. Thus the trend observed in recent years will be maintained and even strengthen. This expectation is also in line with projections of more frequent, extremely strong El Niño events involving major droughts in the eastern half of Australia, should climate change continue.

Growing bushfire hazard in Australia
The IPCC scenarios
The Fifth Assessment Report of the Intergovernmental Panel on Climate Change (IPCC) uses four Representative Concentration Pathway scenarios (RCPs), describing four different 21st century pathways of greenhouse gas atmospheric concentrations, associated with four different levels of radiative forcing reached by the end of the 21st century relative to the pre-industrial period.
Within this range, the RCP8.5 scenario may be termed the worst-case business-as-usual scenario, reaching a radiative forcing of 8.5 W/m2 in 2100 relative to pre-industrial levels. This scenario will lead to a global mean surface temperature increase at the end of the century of +4.3°C (with an uncertainty range of ±1.1°C) relative to 1850–1900.
What the insurance industry needs to do
The insurance industry needs to accept the trends in weather risks and loss distributions due to climate change, and incorporate this in its risk assessment and modelling.
For example, a gradual increase or intensification of severe thunderstorm and hailstorm events in the urban areas of eastern Australia would make it necessary to estimate the resultant rising proportion of required risk capital over time, and to devise an appropriate response, based either on reinsurance or other strategies to secure sufficient risk capital, and/or on other instruments such as deductibles or product innovations.
Understand hazard changes in Australia
Mapping non-stationary temporal risk conditions is a particular challenge for risk models and their probabilistic event sets, because such models are based on stationary statistics. Reflecting the changed hazard levels, and thus also risk levels, for each location in our pricing and hazard-zoning tools will be critical. Doing so will contribute both to raising awareness of the risk and to helping to reduce vulnerability in general.
Building codes must incorporate a buffer for changes in frequency and intensity over the lifetime of buildings or infrastructure; land-use regulations must also be modified and enforced, particularly on the coast. Here again, the insurance industry can use its knowledge of hazard changes, acting in concert with other branches of the economy and the government sectors' mandate to provide basic public services, to bring such changes into the public arena and promote social adaptation to them in order to address the effects of climate change in Australia.
Literature
Allen, J.T., D.J. Karoly, K.J. Walsh, 2014: Future Australian severe thunderstorm environments. Part II: the influence of a strongly warming climate on convective environments. Journal of Climate, 27, DOI: 10.1175/JCLI-D-13-00426.1.
CSIRO and Bureau of Meteorology, 2015: Climate Change in Australia Information for Australia’s Natural Resource Management Regions: Technical Report, CSIRO and Bureau of Meteorology, Australia.
CSIRO and Bureau of Meteorology, 2018: State of the Climate 2018.
Jolly, W.M. et al., 2015: Climate-induced variations in global wildfire danger from 1979 to 2013. Nature communications, 6:7537, DOI: 10.1038/ncomms8537.
Ummenhofer, C.C., et al., 2009: What causes southeast Australia’s worst droughts? Geophysical Research Letters, 36, doi:10.1029/2008GL036801.
Downloads
Munich Re Experts

/Hawkins_Scott_BJM0691_1x1.jpg/_jcr_content/renditions/crop-1x1-400.jpg./crop-1x1-400.jpg)
/Gottardo_Chris.jpg/_jcr_content/renditions/original./Gottardo_Chris.jpg)
Related Topics
Newsletter
properties.trackTitle
properties.trackSubtitle
