A post-pandemic perspective

Munich Re’s actuaries, data scientists, and medical doctors use a wide range of data sources to study mortality trends and develop Group Life mortality projections. These include two key Society of Actuaries (SOA) resources that shed light on recent Group Life mortality trends, including the disruptive impact of the COVID-19 pandemic.
The 2024 Group Life Seriatim Experience Study spans nine years of data from 2013 to 2021, encompassing exposures, deaths, and Waiver of Premium incidences across millions of life years and multiple policy types (Table 1). Its longitudinal view allows actuaries and insurers to assess both long-term trends and short-term anomalies.

Complementing this is the SOA’s quarterly Group Life Mortality Survey Report Series, launched in Q2 2020 to track pandemic and post-pandemic mortality. Participants and sponsors of this ongoing survey gain access to granular Group Life mortality results each quarter, including trends by age, gender, and cause of death. Leveraging publicly available data through year-end 2023, the survey provides timely insights into how COVID-19 and other causes of death have affected Group Life portfolios.
Highlights from the studies:
Overall Basic Group Life mortality by count improved notably in the pre-pandemic years of 2013-2019, but not at the same level of improvement for all age/gender groups.
The mortality age curve flattened dramatically in the 2024 study as compared to the 2016 study.
Group Life mortality spiked materially from Q2 2020 through Q4 of 2022 due to the COVID-19 pandemic. The worst of the spike occurred in the fall/winter of 2021 during the Delta wave. Many non-COVID causes of death also spiked during this pandemic period, in addition to the new COVID-19 cause of death.
As of year-end 2023, overall Group Life mortality rates by count were below the corresponding 2017-2019 pre-pandemic levels. But this is not good news for all age groups. The 25-44 age group was still experiencing excess non-COVID mortality due to several causes through full year 2023. As a result, the overall mortality actual-to-expected (A/E) ratios by trended face amount are slightly higher than the overall mortality A/Es by count.
Improvement in mortality rates
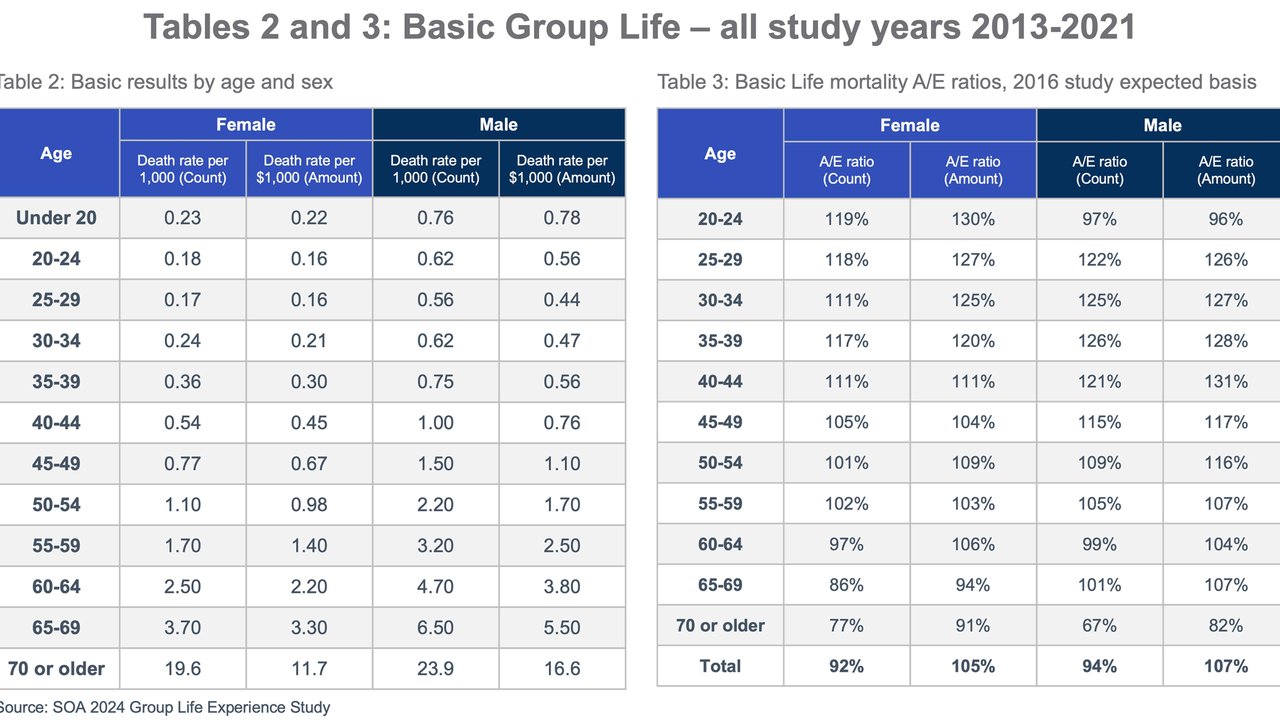

These disparities underscore the importance of considering both count-based and amount-based metrics when evaluating mortality trends. They also highlight the need for nuanced underwriting and pricing strategies that account for demographic and socioeconomic variations.
One of the most striking findings from the 2024 Study is the flattening of the mortality age curve (Table 5). Compared to the 2016 Study, the rate at which mortality increases with age has slowed. For example, males aged 45 to 65 previously saw an approximate 9% annual increase in expected mortality; this has now dropped to roughly 8%.

COVID impact and other contributing factors
From Q2 2020 through Q4 2022, Group Life mortality spiked dramatically due to the COVID-19 pandemic. The most severe surge occurred during the Delta wave in late 2021, when COVID-related deaths accounted for roughly 15% of all Group Life claims. But COVID wasn’t the only culprit – non-COVID causes such as cardiovascular disease, stroke, diabetes, accidents, drug overdoses, and homicides also rose during this period.
The SOA’s COVID Mortality Survey, which includes data from 20 carriers representing roughly 85% of the Group Life market, tracked these trends in detail. By 2023, mortality rates had declined below pre-pandemic levels, with A/E ratios by count falling to 97% (see top right corner of Table 6). However, we estimate the year-end 2023 figure remained 3-5% higher than it would have been had the pre-pandemic downward trend continued uninterrupted.
Row 2 of Table 7 shows that Group Life mortality A/Es by trended face amount remained higher than the corresponding A/Es by count through year-end 2023. Group Life face amounts are often multiples of salary, and the SOA trend factors assume that face amounts grew by 2% per year during 2017-2019 and 3% per year in 2020 and later.


Leveraging report data
The data from the 2024 Study and COVID Survey offer insights for several business areas:
Underwriting and pricing: The flattening mortality curve and demographic disparities call for more granular underwriting models that account for age, gender, and socioeconomic status.
Product design: Persistent excess mortality among younger age groups may warrant reconsideration of benefit structures and face amount multipliers.
Risk management: The pandemic highlighted the need for agile risk assessment frameworks that can respond to sudden mortality shocks.
Predictive modeling: The availability of detailed data, including pivot tables and CSV files with millions of rows, enables actuaries to build sophisticated models using tools such as R and Python. These models can uncover interactions between variables such as industry, geography, and case size.
Looking forward
As of year-end 2023, Group Life mortality rates have largely stabilized, although overall mortality remained elevated as compared to the pre-pandemic trendline projected forward. Munich Re’s research and access to public data sources suggest that overall Group Life mortality has continued to improve from year-end 2023 through mid-year 2025. However, younger ages have continued to display mortality rates for specific causes that are above pre-pandemic levels, noting that some of these younger age causes, such as overdoses and accidents, were already trending up before the pandemic. We are still seeing a much smaller number of COVID deaths each year, especially among older adults during the winter months.
The landscape remains complex. The pandemic has reshaped mortality patterns, and its ripple effects continue to influence outcomes. Ongoing monitoring and analysis will be essential to navigate this evolving terrain.
Munich Re’s ability to analyze mortality trends with exceptional granularity enables us to uncover nuanced patterns and emerging risks. Clients of Munich Re benefit even further, as we evaluate their specific data against these broader trends to deliver tailored insights that support more informed decision-making and strategic planning.
Contact the author
/Steve%20Rulis.jpg/_jcr_content/renditions/crop-1x1-400.jpg./crop-1x1-400.jpg "Steve Rulis")


