Preferred Underwriting Wear-Off and Preferred-Class Mortality in the Post Level Term Period

Munich Re’s North American biometric research team continually monitors industry experience (mortality, morbidity, lapses). We hope to stimulate discussion with our business partners and across the insurance industry by sharing our key findings. We believe these discussions will lead to a better understanding of the emerging experience and its importance in assessing the underlying risk.
This paper is the second in a series taking a deep look into the data provided by the most recent Individual Life Insurance Mortality Report from the Individual Life Experience Committee (ILEC) of the Society of Actuaries. An earlier paper considered variation in the underlying experience by type of product and whether the number of preferred classes offered affects mortality overall and by duration. This paper will answer the remaining two questions concerning preferred wear-off and post-level term mortality:
- Is there any indication of preferred wear-off?
- What is the preferred class mortality experience after the level term period for 10-year term products?
Over the last 40 years, the life insurance risk selection and product design across North America have changed dramatically. The introduction of smoker-distinguished rates in the early 1980s was followed by preferred underwriting, which was followed by refinement into an increasing number of preferred classes. More recently, accelerated underwriting programs were added. At the same time, universal life products were introduced, bringing about different policyholder behaviors. As a result of all of these changes, actual experience reflects a variety of underwriting eras, and types of products, sales channels, and delivery vehicles.
Understanding the complexity of experience as it emerges is crucial to setting appropriate mortality assumptions for new business pricing and for valuation of the in-force portfolio.
The ILEC 2009-2013 data files enable actuaries to extend their analysis beyond the published reports. Munich Re’s North American biometric research team has studied the data files and offers a few observations. Our analysis focuses on actual to expected (A/E) by amount, with the 2015 VBT as the expected basis, and analysis was limited to a core segment of the ILEC 0913 data:
- Non-smoker.
- Male and female combined.
- $100,000-$2,499,000 face amount.
- Durations 1-15.
- Issue ages 30-59.
- Issue year 1990 or later.
Experience by preferred classes— is there presence of wear-off?
Term experience shows a downward trend in A/E ratios for three and four-class structures, which is driven by interactions between the preferred and residual classes within each preferred structure. We have examined each structure by analyzing the movement of A/E results in durational groups. Chart 1 on page 2 illustrates the differences between preferred class results for a specific durational group as well as movement in the A/E as duration increases.
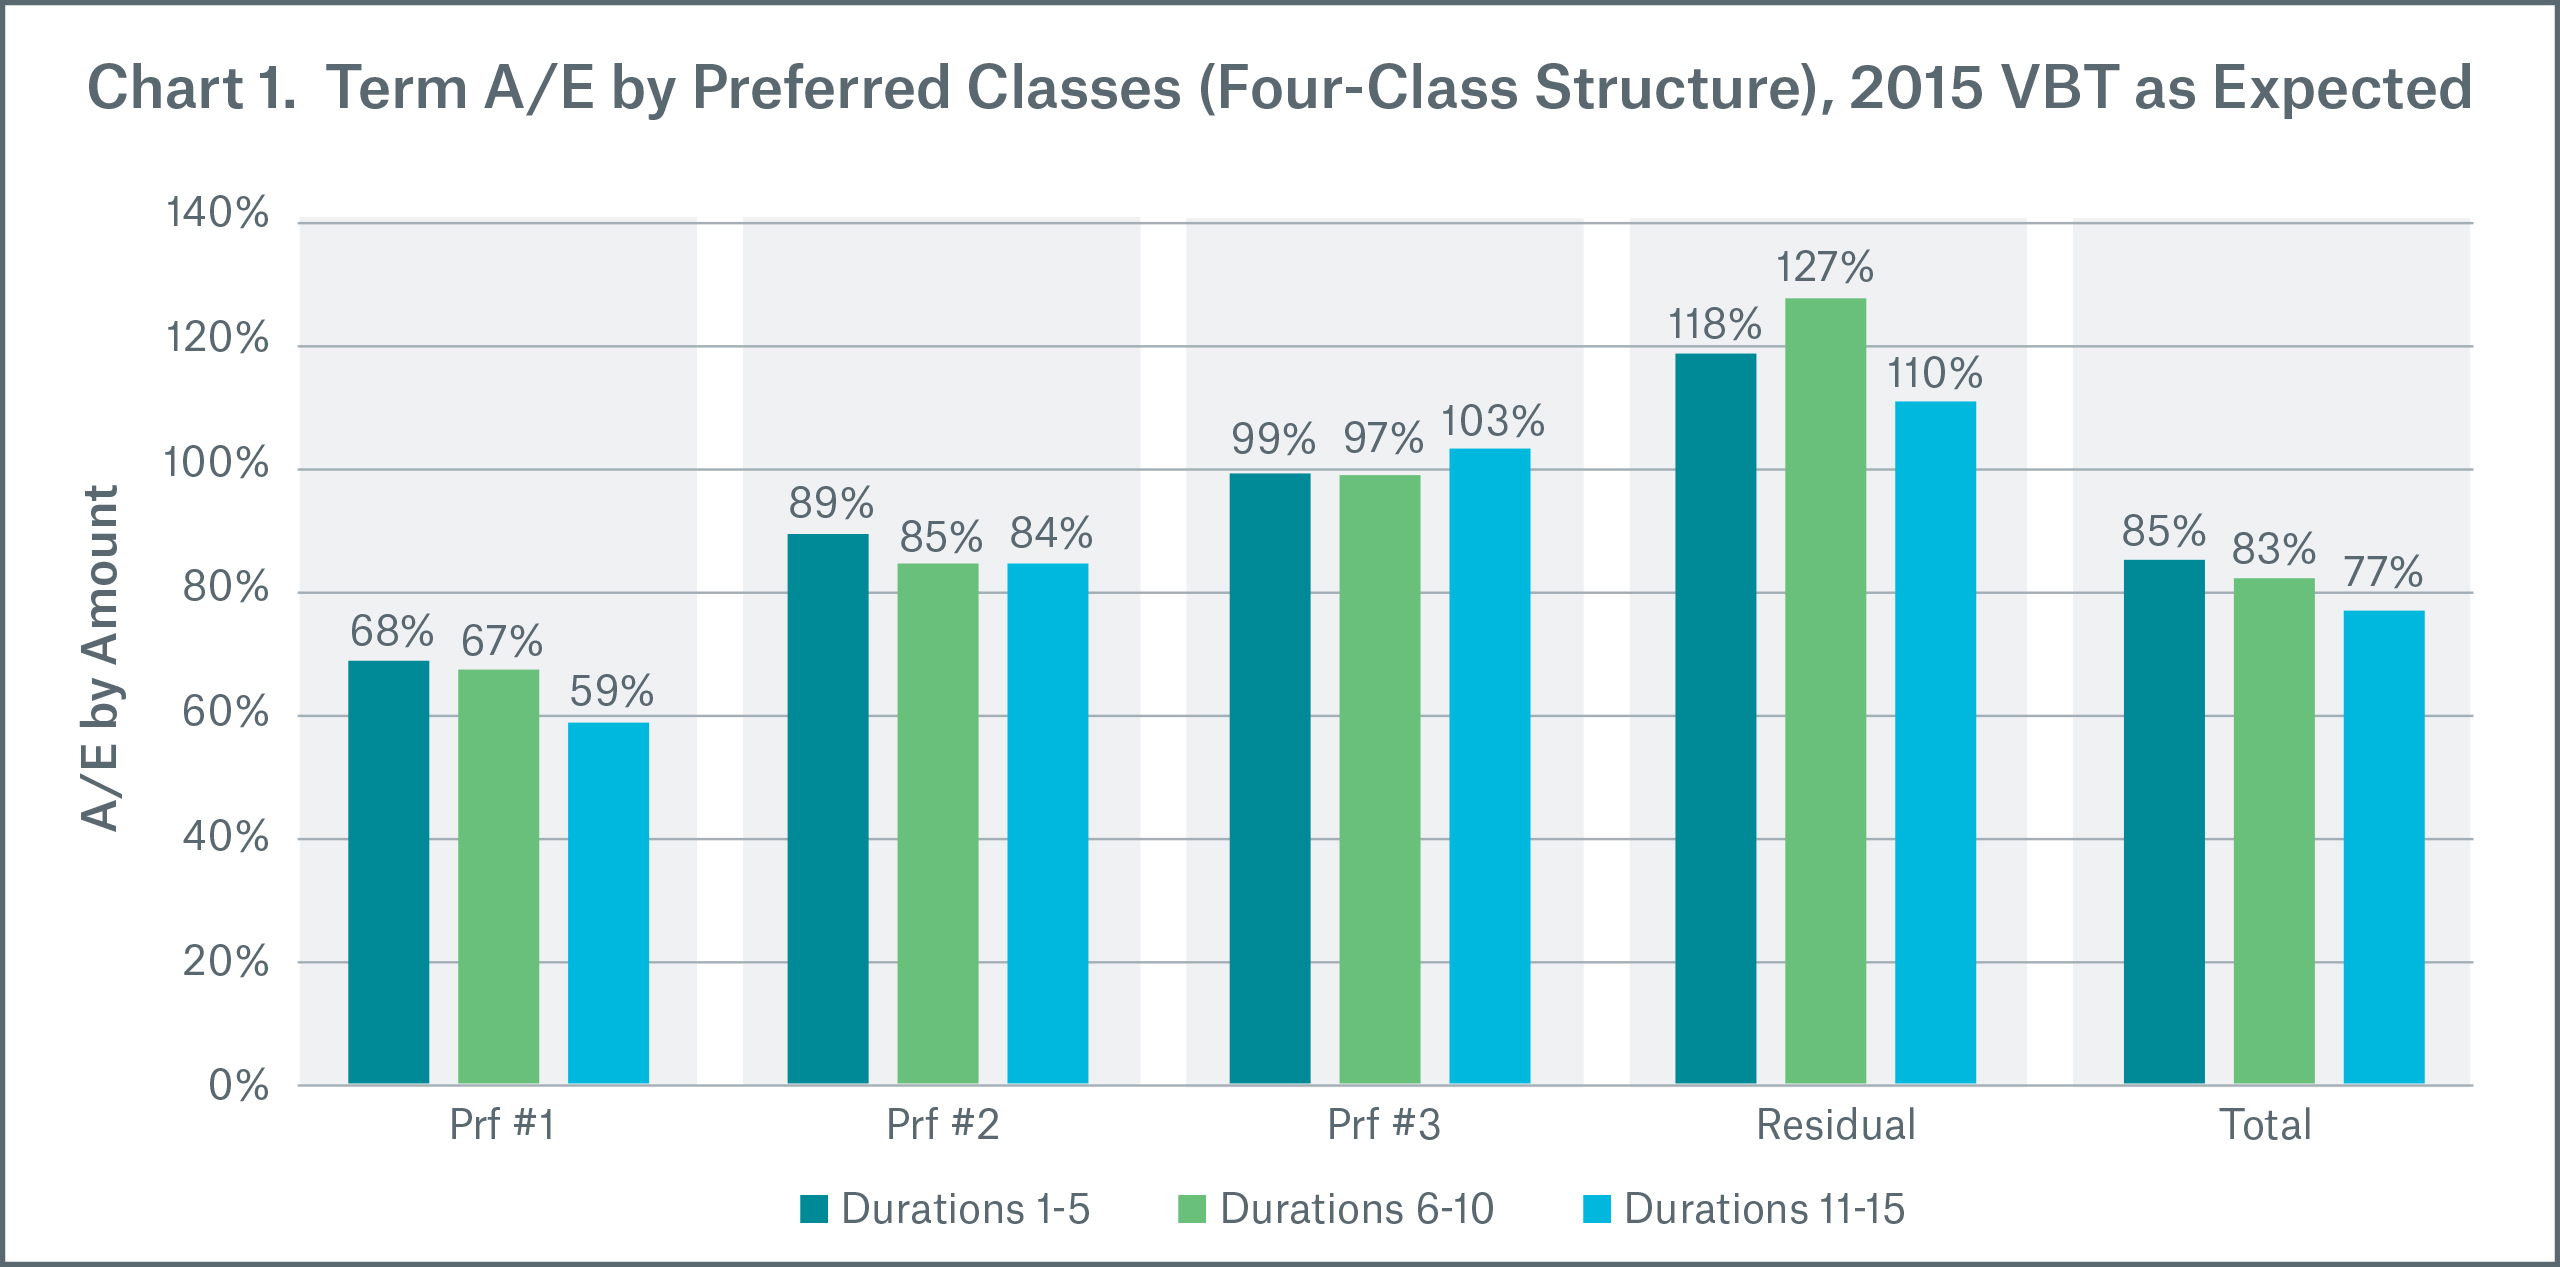
In the chart above, “Total” is the average A/E of the class-specific mortality for four-class term products. The A/E ratios vary significantly from the best preferred to the residual class. We see that A/E for preferred classes are relatively stable in terms of the 2015 VBT at durations 1-10, but start to move down for the best class (Prf #1) and up for Prf #3. There is a material drop in residual class A/E in durations 11-15.
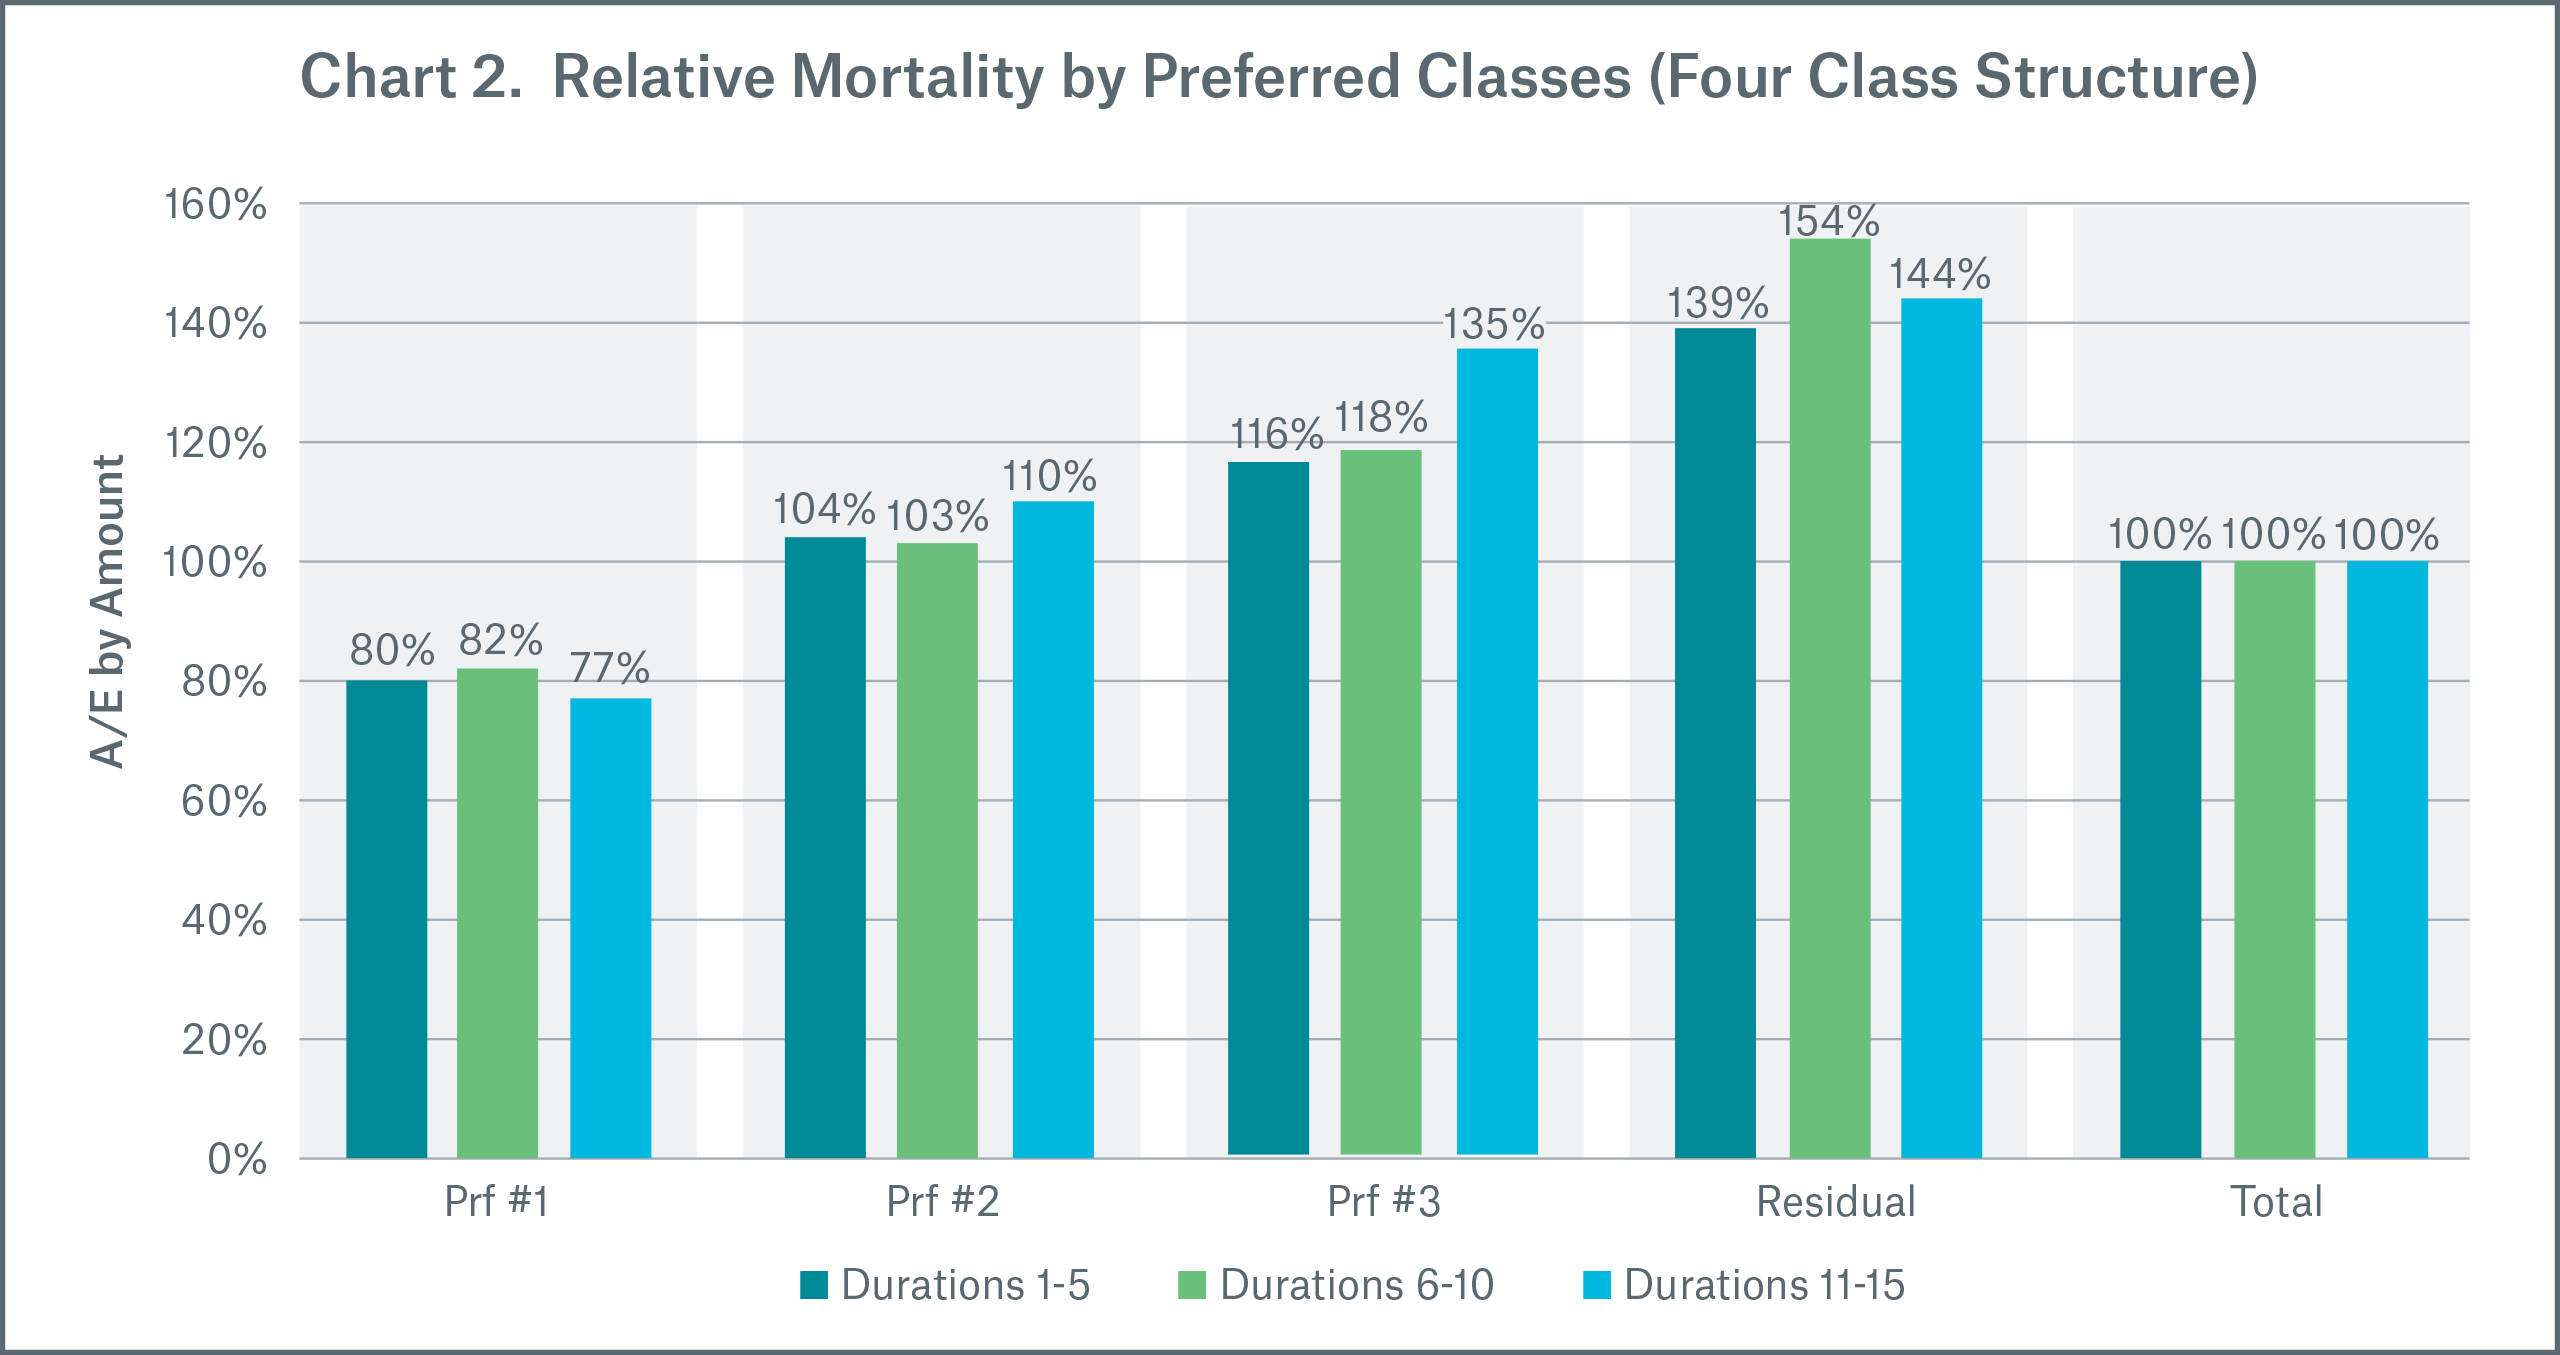
Another way to understand how mortality by class is changing over time is by expressing class-specific mortality as a percentage of the total for each duration (class specific relative mortality).
As shown in Chart 2 below, stability in the relative mortality of the preferred classes at durations 1-10 indicates that there is no preferred underwriting wear-off in the first 10 years. The data is less conclusive for durations 11-15 due to the convergence of Prf #3 and residual classes, the small upward trend for Prf #2 and the downward change for the best preferred class.
Since the experience period is relatively short, the durational groups represent different issue year eras and potentially different underwriting (for example, the mix of experience by contributing companies). One explanation for the movement in relative mortality for durations 11-15 compared to durations 1-10 could be a change in the product mix. Duration 1-10 data includes three main term products—term 10, 15 and 20. However, term 10 was excluded from duration 11-15 analysis due to mortality deterioration in the post-level period. As a result, the exposure in duration 11-15 by amount (all classes combined) is less than 30 percent that of duration 6-10. We will continue to closely monitor developments in duration 11 and later due to their importance in assessing the actual wear off of preferred underwriting over time.
T10 Post Level Term Preferred Experience
Preferred term 10 post level term (PLT) experience is just beginning to emerge. We are analyzing a core dataset with $92.5 billion exposure and 1,298 deaths (420 claims for two-class structure, 476 claims for three-class structure, and 402 claims for four-class structure). There is a 93 percent drop in exposure from durations 6-10 to 11-15 ($1,273 billion compared to $92.5 billion). This decrease was greater for four-class structure products (approximately 95 percent) and smaller for two-class structure products (approximately 80 percent). At the same time, the distribution of duration 11-15 exposure by preferred class within each structure did not change significantly when compared to durations 6-10. To measure PLT mortality deterioration we have to establish a baseline mortality for durations 11-15. In our analysis, we used term 10/15/20 combined experience as a percentage of 2015 VBT for durations 6-10 as the underlying term 10 mortality for the PLT period (Chart 3).
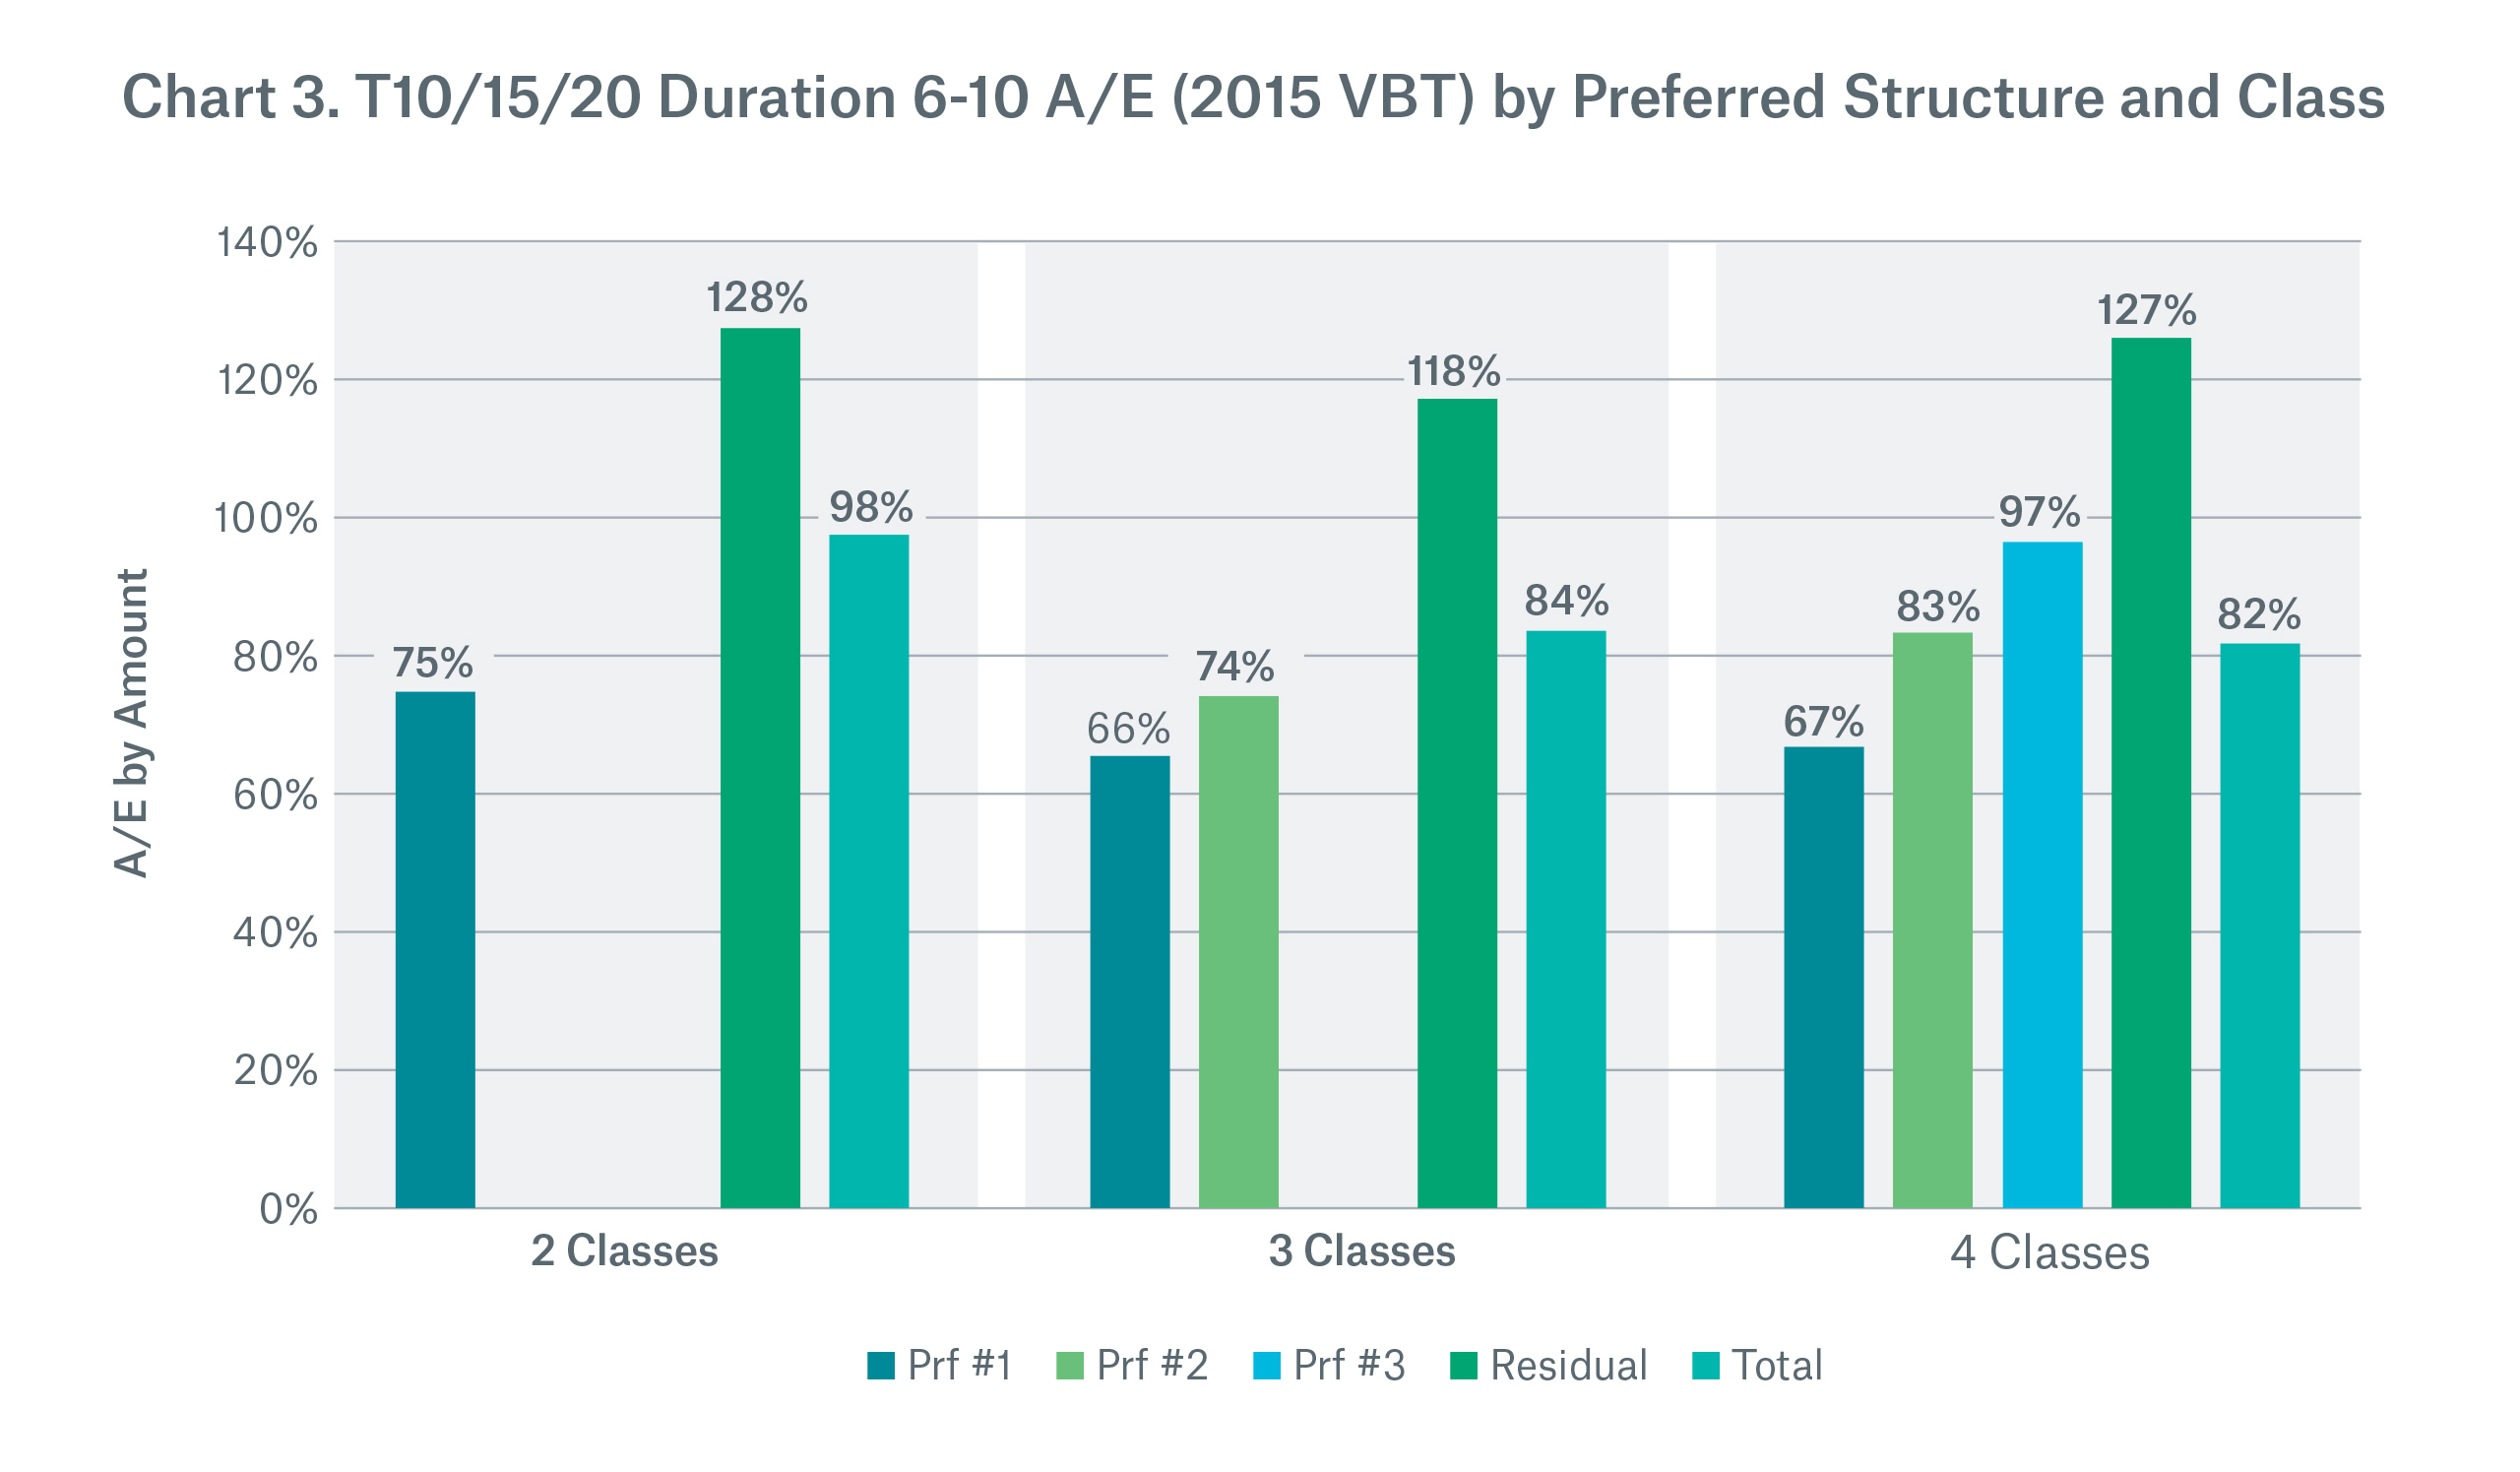
Baseline mortality could be calculated in a number of ways. Baseline mortality for durations 11-15 could be an average for a specific class structure (i.e., 98 percent for a two-class structure, 84 percent for a three-class structure, and 82 percent for a four-class structure), or it could be class-specific mortality within a single class structure such as 75 percent and 128 percent for the two-class structure. In the second case, the baseline includes a discount or load for preferred or residual classes that varies by class structure.
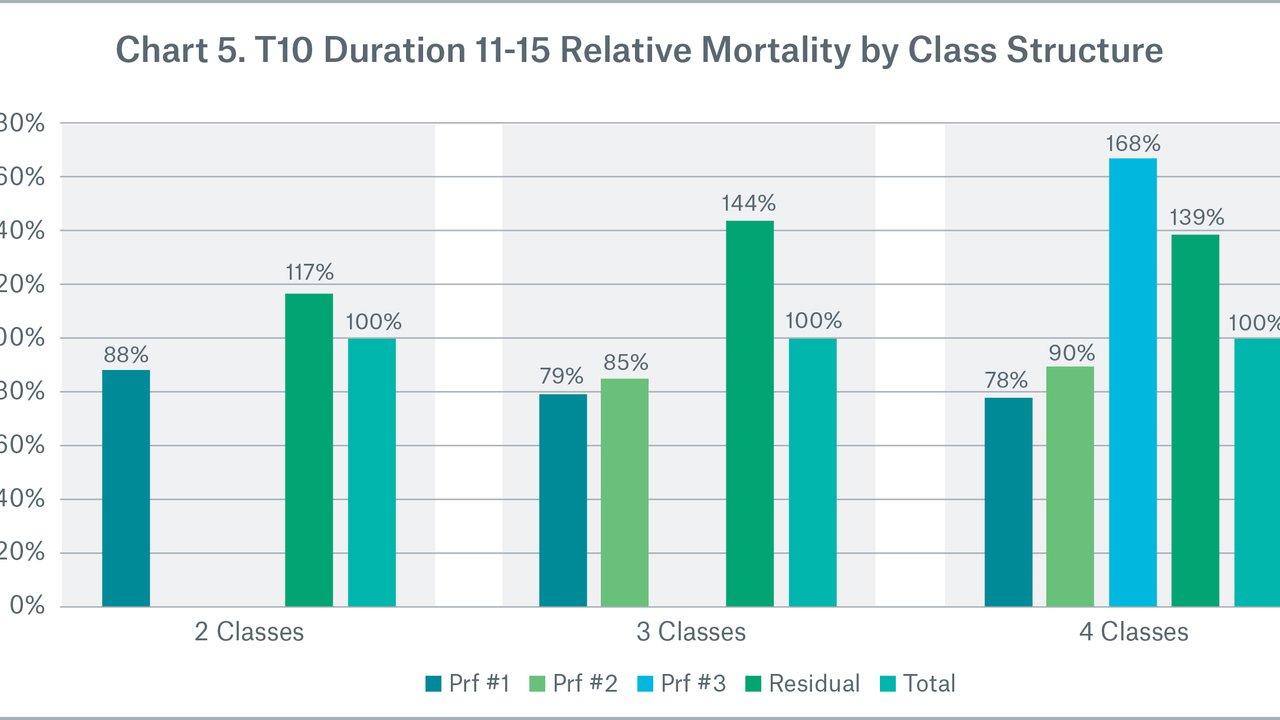
Chart 4 and Chart 5 show PLT mortality by class structure against average mortality at duration 6-10. As expected, PLT mortality shows a steep mortality increase. There is a significant variation in mortality between the preferred and residual classes for two-class products. The gap is even bigger for three- and four-class segments as shown below (Prf #1 and Prf #2 compared to residual).
Chart 5 looks at the same data but in terms of relative mortality, calculated by dividing the class-specific percentage in Chart 4 by the class structure total in Chart 4.
An explanation for the relative mortality gap between preferred classes and residual (except Prf #3 for four-class structure, where experience is limited to 70 claims) could be non-rational policyholder behavior. Rational lapse decisions should lead to similar preferred and residual average post level term mortality. The observed gap could also be a function of significant differences between preferred and residual classes in the underlying lapses at the end of the level period. Unfortunately, the ILEC 0913 data doesn’t include enough information on class level premium jump or lapses to perform deeper analysis of the observed phenomena.
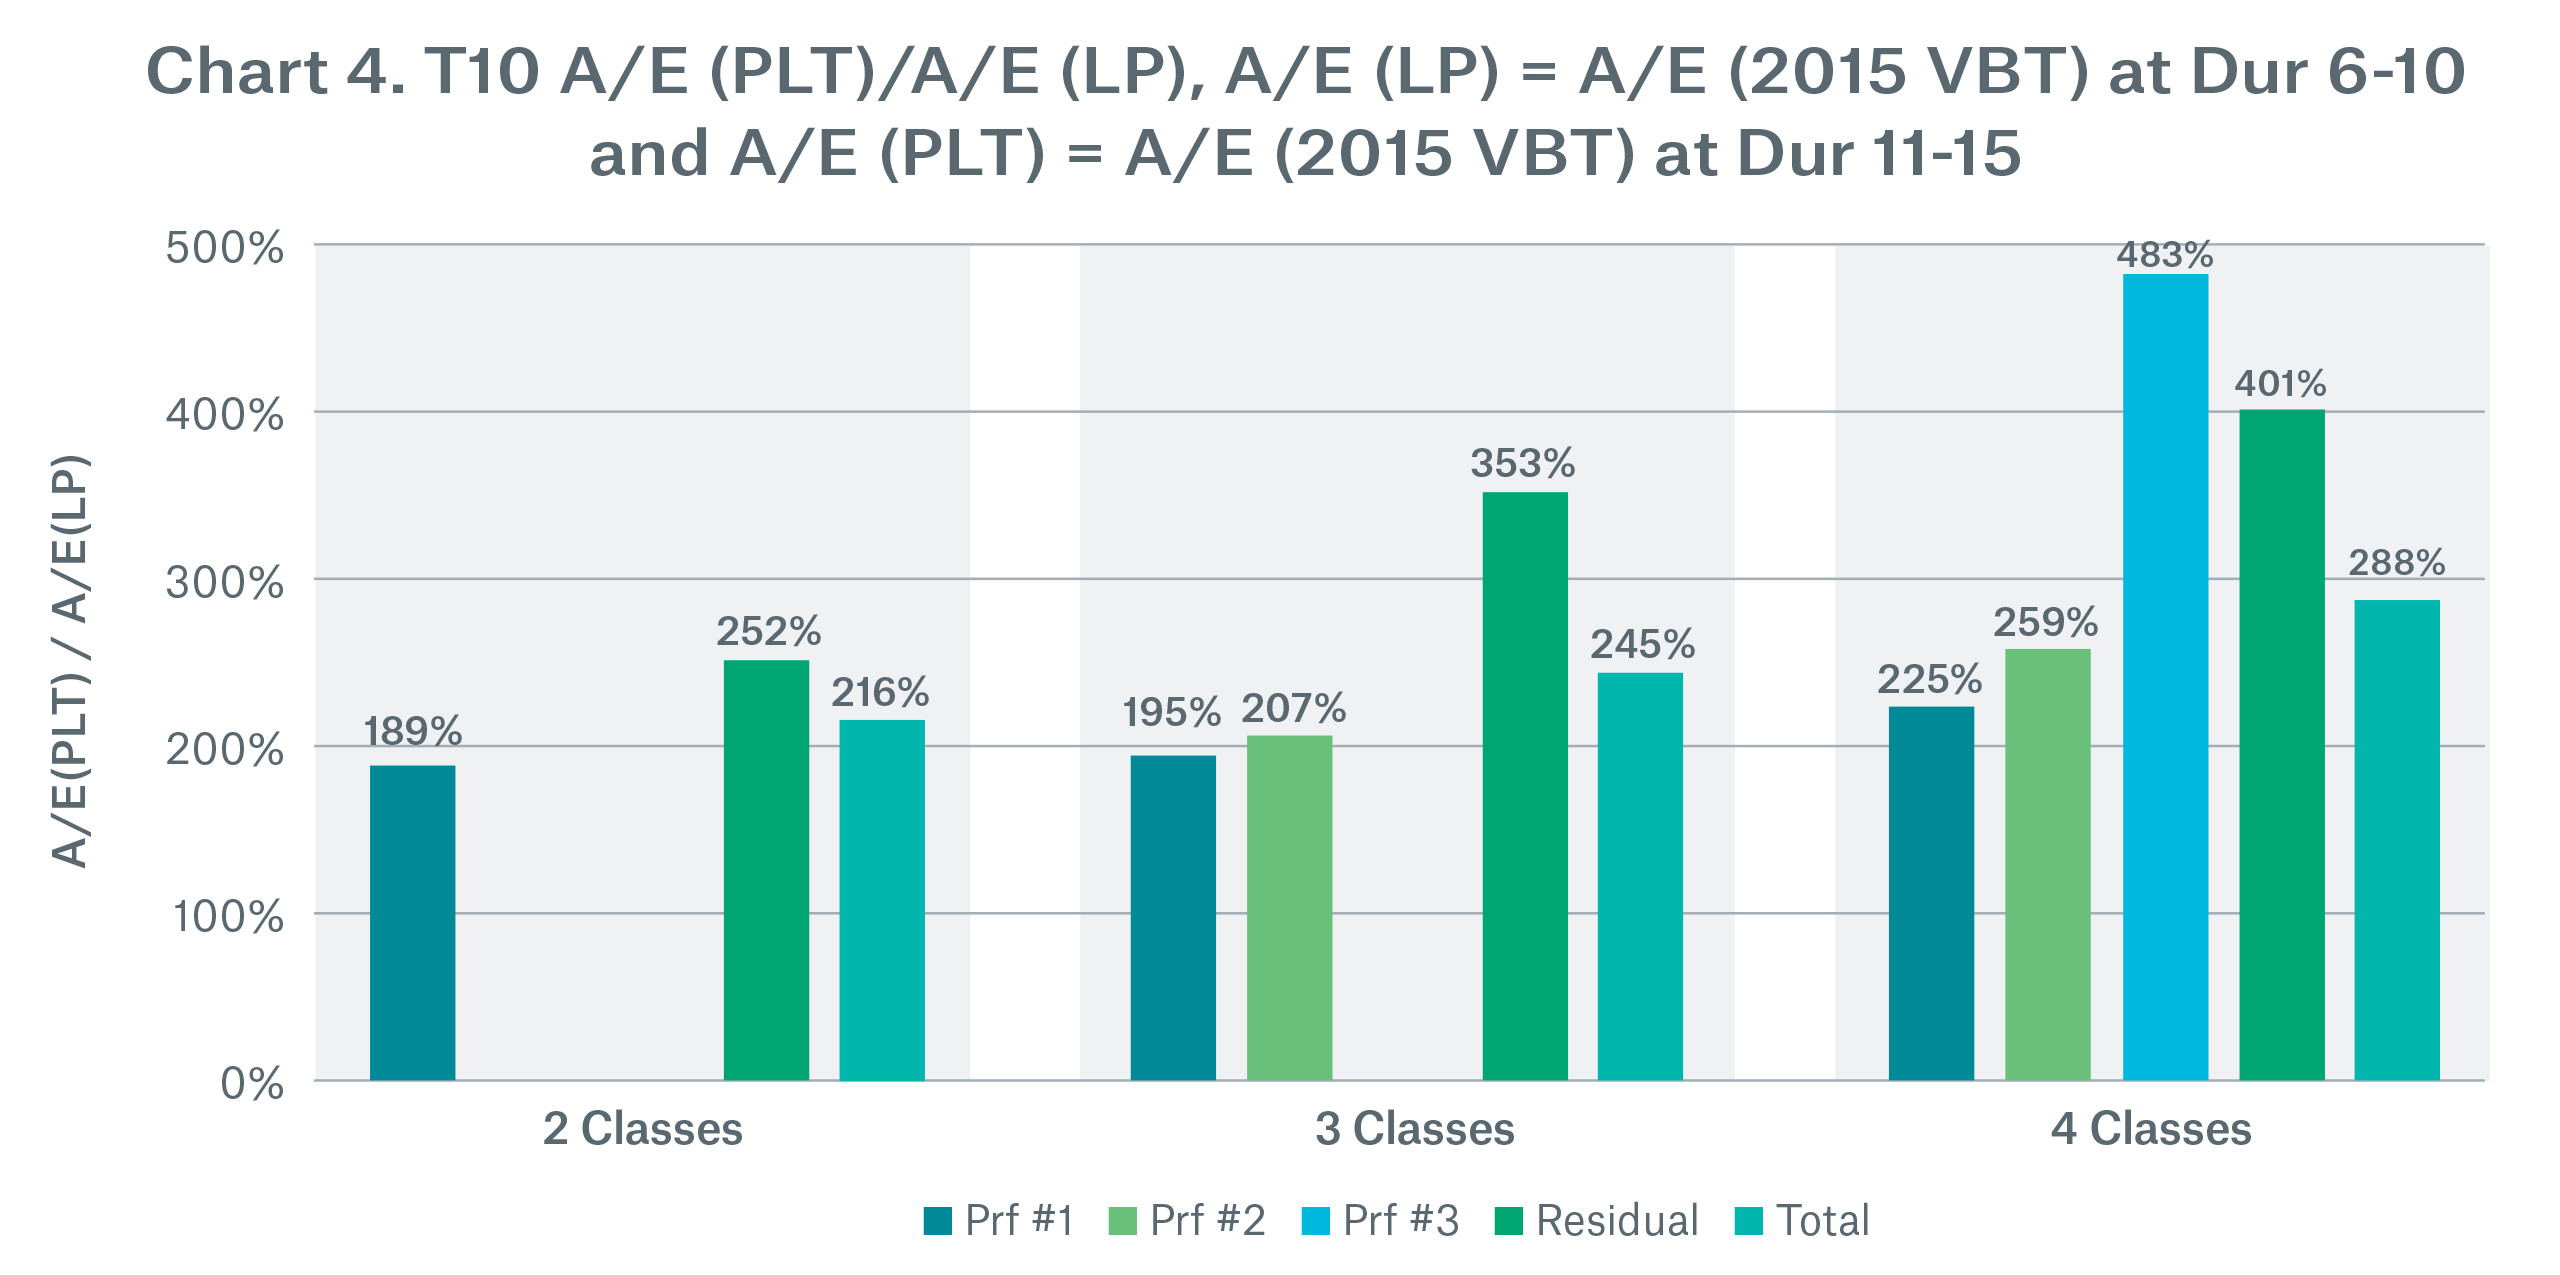
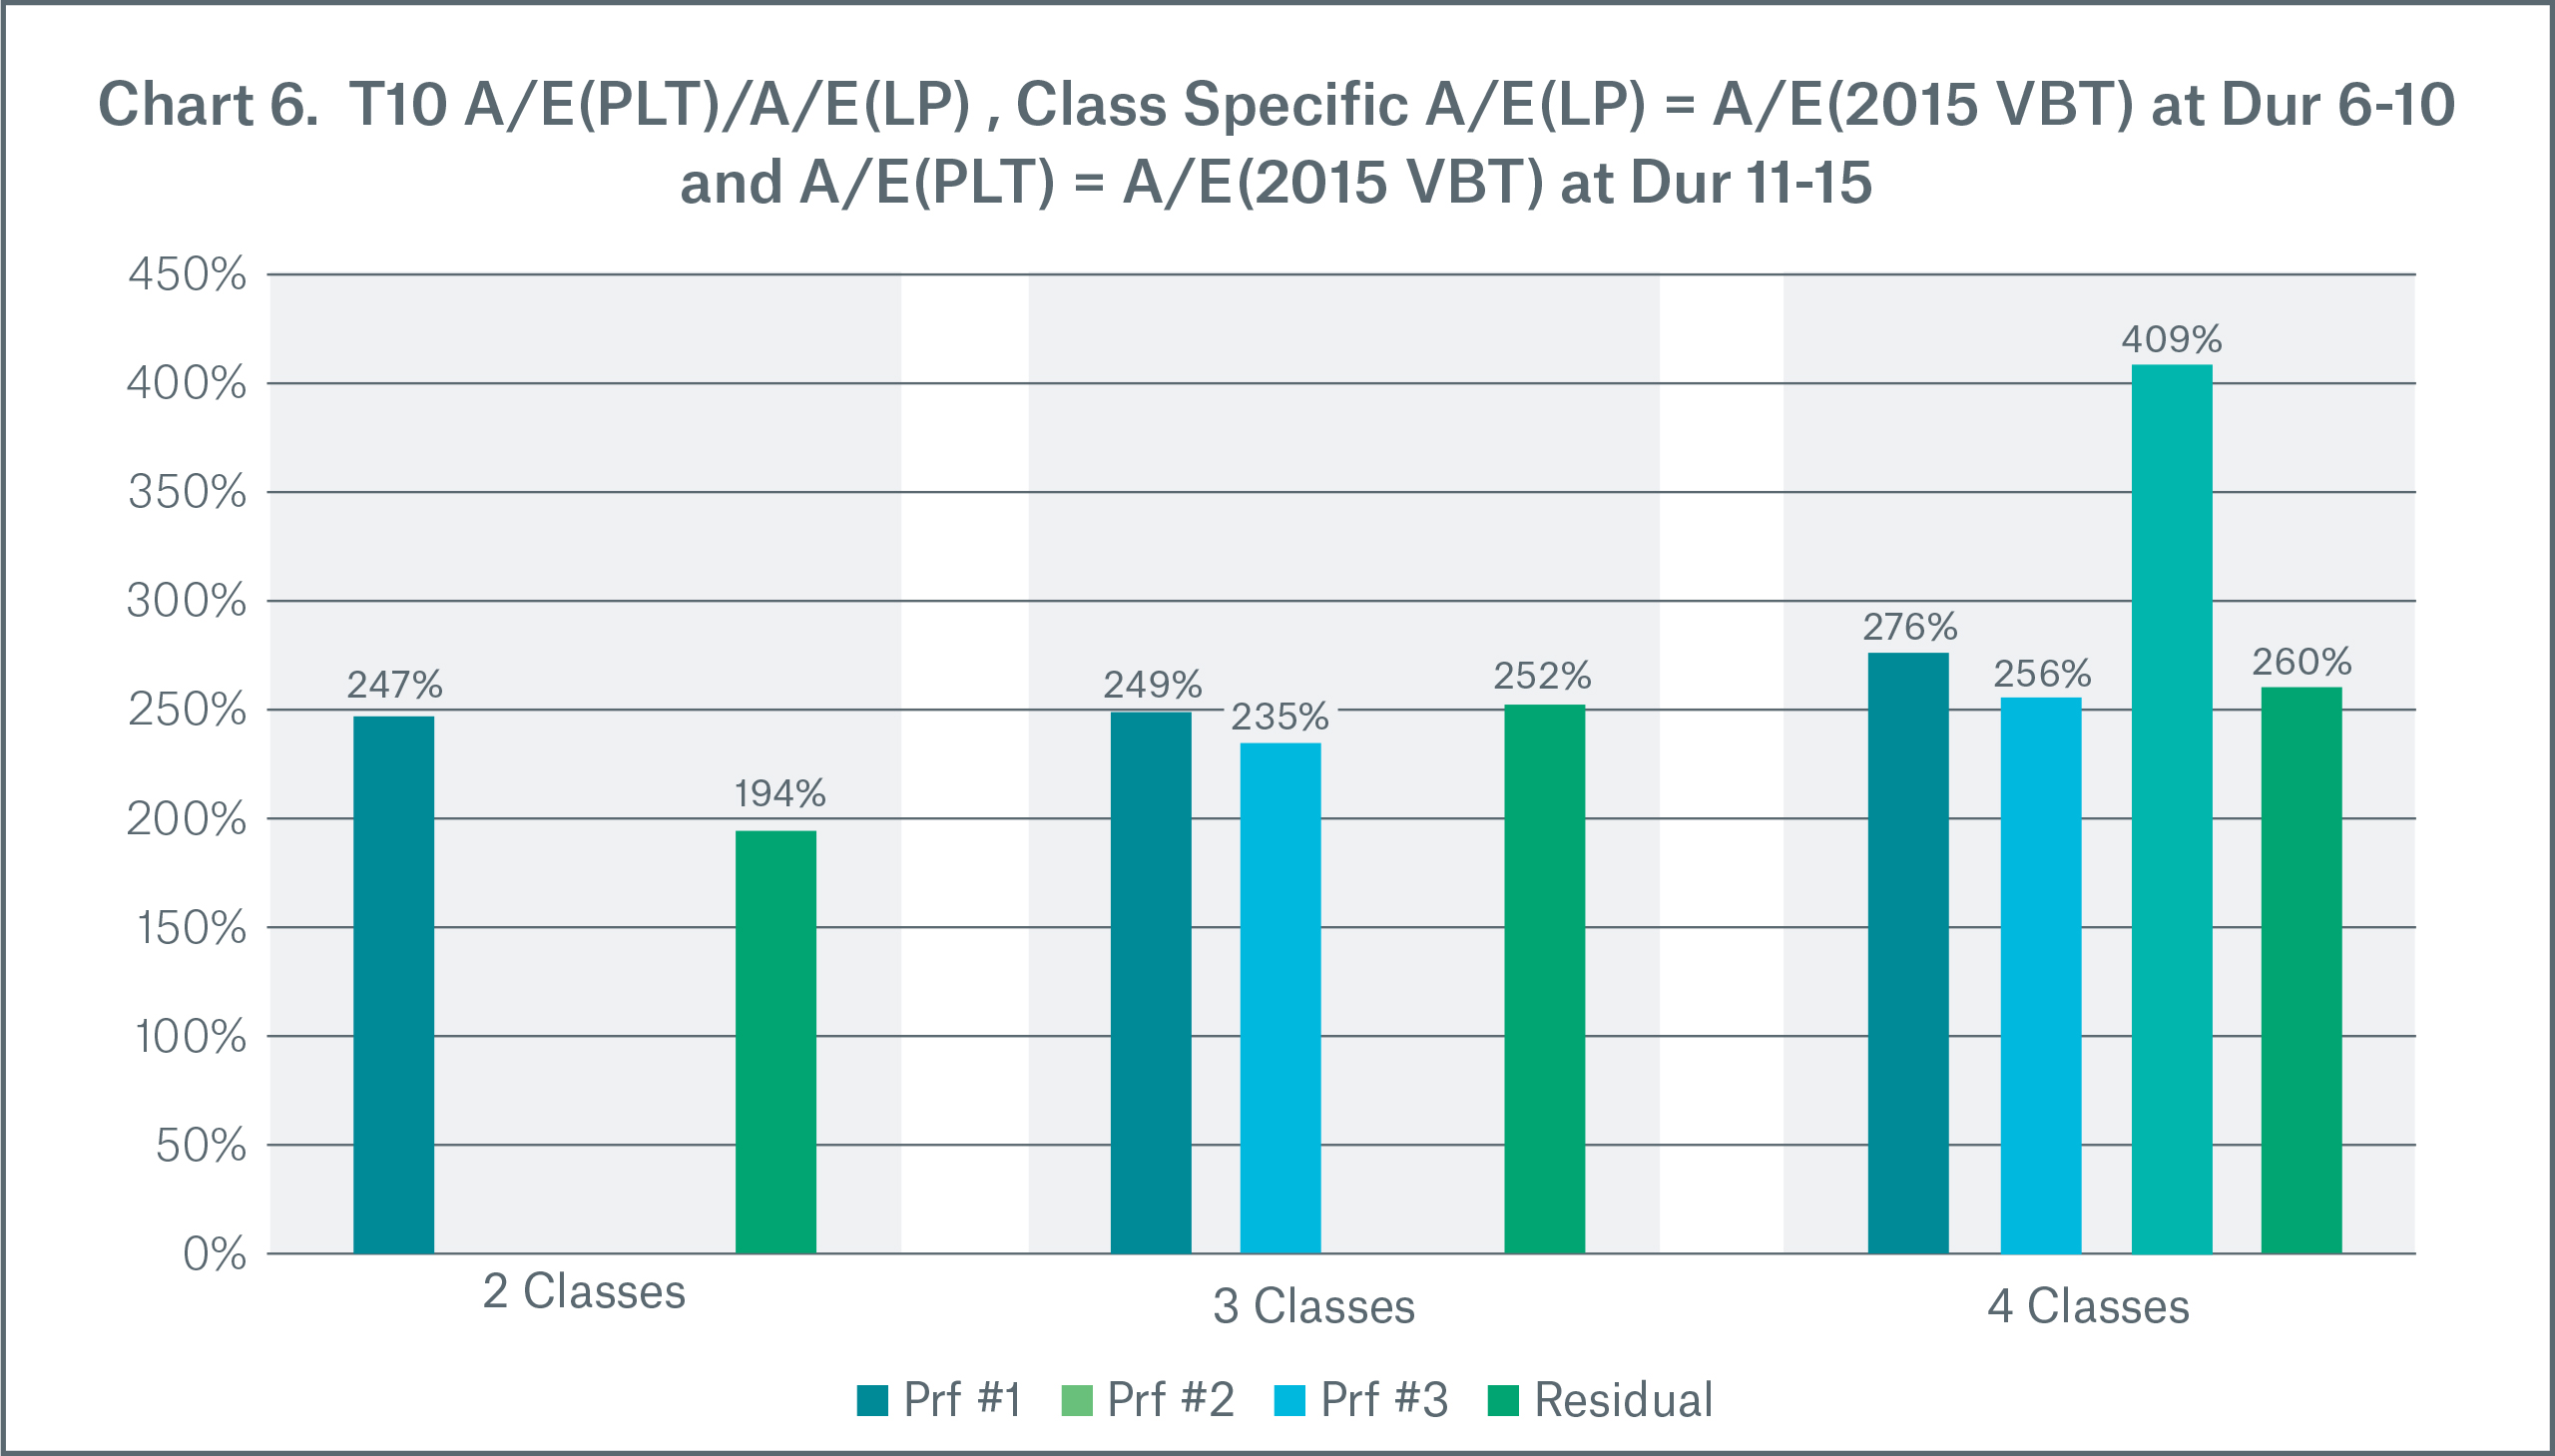
Mortality deterioration is very similar between preferred and residual classes, except for residual in two-class structures and Prf #3 in four-class structures, where we have previously noted that there are only 70 claims. In addition, there is no premium jump or lapse data to support further analysis of the key drivers behind the observed pattern.
As we have already observed, T10 PLT preferred experience is still emerging. As a part of Munich Re’s ongoing PLT project, we will continue to closely monitor mortality by preferred classes and share our findings as they become available.
Conclusion
The ILEC 0913 data is a valuable source of the emerged industry experience. We have outlined some of the experience variation that could be material in setting mortality assumptions:
• Differences by product type – term vs. perm
• Experience variation by preferred structure
• Preferred wear-off
• T10 PLT experience
However, a significant heterogeneity of the data should be taken into account by any user in their own work.
Again, we believe that sharing some of our findings will lead to better understanding the key drivers behind emerged experience and will stimulate further discussion.
Note: The ILEC data files can be found at https://soa.org/experience-studies/2017/2009-13-indiv-life-ins-mort-exp/.
Contact:
/Colin%20Sproat.jpg/_jcr_content/renditions/original./Colin%20Sproat.jpg)
Related Topics
Newsletter
properties.trackTitle
properties.trackSubtitle


