Creating a Competitive Edge

Introduction
When underwriting group life prospects, the primary focus for the underwriter is evaluating the prior experience and current demographics of the group. This information is normally provided by the group or broker as a standard part of a proposal request. The proposal request includes considerable material with key data in the form of census data and prior claims/premium experience. The underwriter has a challenging task in reviewing this material and making tough decisions regarding information to include or exclude, and the weight to apply to specific data. Experience exhibits and manual raters are the primary tools underwriters use to price group life opportunities. These tools provide the best indicators of future results for the group, but is it the complete picture? Accurately evaluating and entering census and experience data is important, but understanding the underlying components of these rating tools is a key part of underwriting.
For instance, manual raters consider a number of risk characteristics applied to both individuals and to the overall group to derive a recommended rate. Loads and discounts are applied to a number of factors, such as age, gender, salary, face amount, location, experience, group size, and industry. Though there is some consistency, both the criteria and adjustments in the manual raters are different with each insurance carrier. The underwriter should understand the key components of their respective company’s rating tools. This knowledge will assist underwriters in deciding if the recommended rate and the applied data have fully and accurately considered the risk.
Also, understanding the underlying drivers of individual mortality is important. Familiarity with death rates and mortality trends is an example of knowledge that on the surface might not seem crucial when evaluating group risk, but it’s an important piece of the underwriting puzzle. One example is the disparity in mortality based on wealth and income. People who earn less income have a lower life expectancy than higher wage earners. This not only applies at the extreme ends of the income scale, but mortality consistently improves as income increases.
Finally, the underwriter must weigh information from a number of sources that can affect pricing decisions. Information learned may influence if discounts or loads are warranted and perhaps whether to accept or decline the risk. There are a variety of risk factors that have to be considered when weighing underwriting decisions. We will examine some of the primary drivers of mortality in the U.S. population and also in group life, discuss possible reasons for the demographic differences in mortality, as well as identify recent trends. In addition to being “good to know” information, we feel this knowledge will make better underwriters because creating an underwriting edge is crucial in the competitive group insurance market.
U.S. Mortality
As evidenced by continuing experience studies conducted by the Society of Actuaries (SOA), academic researchers and individual companies, longevity in the U.S. has continually improved over the past 100 years. According to the Social Security Administration, in 1910 a 65-year-old male was expected to live to age 76 and a 65-year-old female to age 77; in 2010 a 65-year-old male was expected to live to age 82 and a 65-year-old female to age 85.1
If we look at mortality rates of the general population for approximately the last 20 years, it has continued to improve with some leveling off the last few years. The recent mortality improvements from medical advancements in the treatment of cancer, heart disease, and other conditions has been partially offset by the increase in accidental death in younger ages. Unlike older ages, accidental deaths is the leading cause of death in younger people.
In recent years, we have seen an increase in accidental death from motor vehicle accidents, likely attributed to distracted driving. All but two states have enacted some form of either texting ban, cell phone, or complete handsfree ban while driving. Thirty-eight states focus these laws on younger people and ban cell phone use for teen or novice drivers, while other states have laws that apply to drivers of all ages.2 While there are no studies that have been able to separate distracted driving from other motor vehicle accidents, state governments have recognized distracted driving as a problem, particularly for younger ages.
Another reason for the increase in accidental deaths is from the opioid epidemic. Opioid death rates are increasing in dramatic numbers across the U.S. with spikes in recent years. In 2017 the National Safety council saw a record number of preventable deaths (169,936) and the highest death rate since 1973, 52.2 deaths per 100,000 population.3 The biggest change in preventable or accidental death, came
from an increase in death rates due to opioids. The opioid death rates affect a wide range of the population with the highest concentration in younger ages and males in particular.
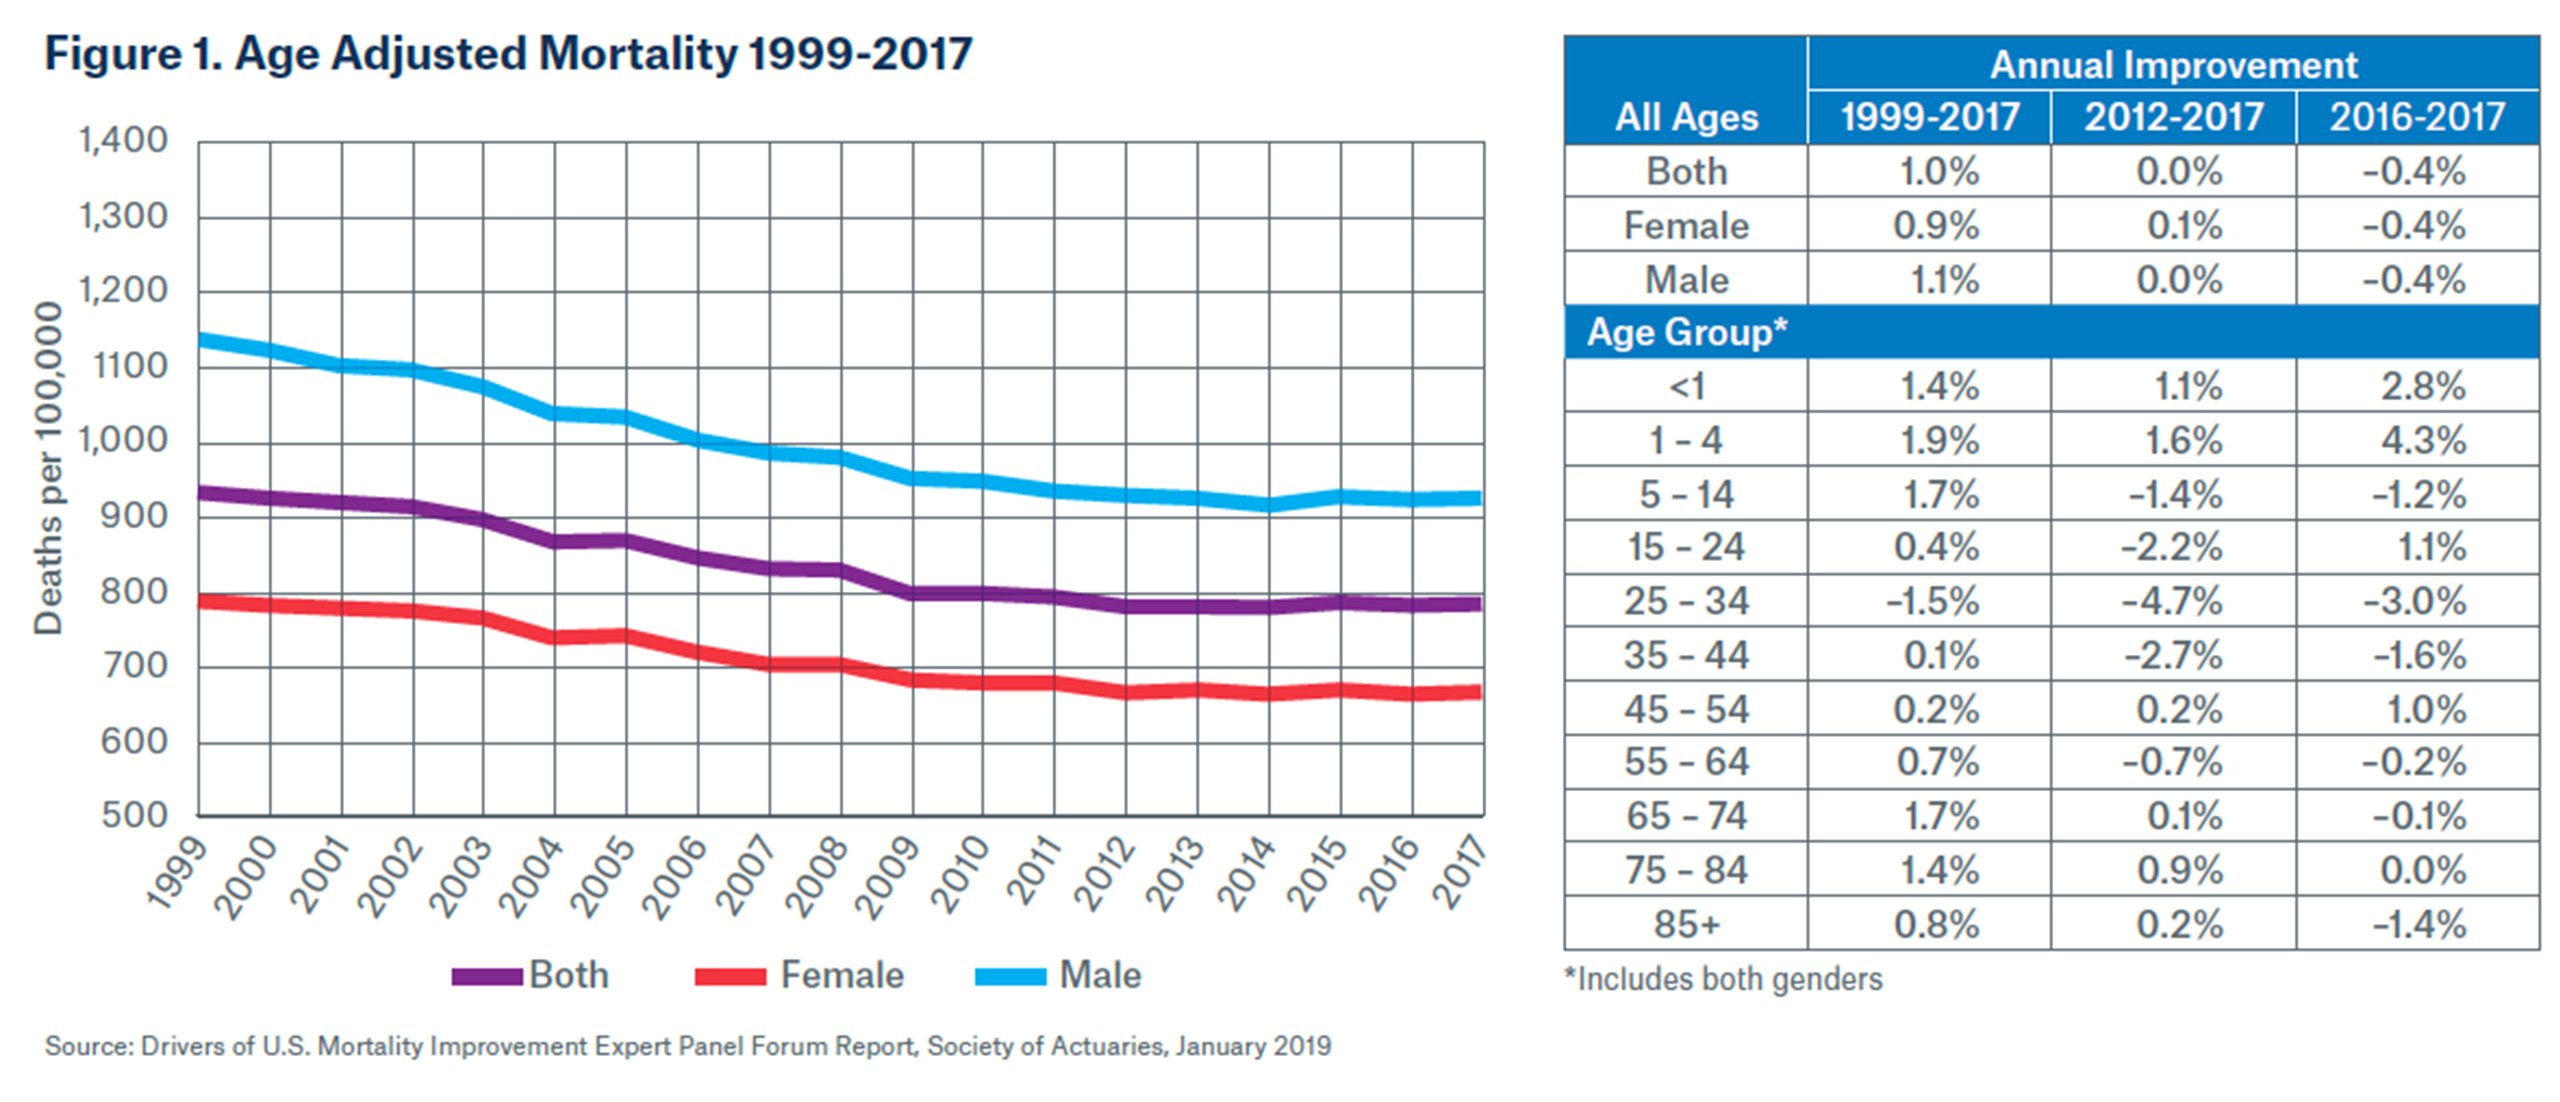
In January, 2019 the SOA published U.S. Population Observations which included 2017 mortality data from the general population. This study included analysis of mortality rates for the period 1999-2017 and separately for the years 2016 and 2017. Figure 1 below shows that annual mortality improvement from 1999-2017 combined (both genders) has been 1.0%. However, combined mortality in the U.S. has not improved since 2012 and actually showed declines in both 2016 and 2017. Male mortality increased
faster than female mortality from 1999-2017, 1.1% vs. .9% annual improvement. The age group 25-34 showed significant negative changes to mortality in both 2016 and 2017 due to the increase in accidental deaths. Overall, this chart shows that mortality has improved approximately 1% per year since 1999 with flattening in recent years.4 Some carriers consider mortality improvements when
evaluating claims experience. Basically, the concept is that the expected mortality improvements is applied to death claims incurred in previous years that effectively lowers the expected future claim rate. Adding mortality improvements to experience calculations is complex and may require actuarial feedback, but underwriters should at least be aware of the rationale for this adjustment.

Group Life Characteristics vs. General Population
The group life population is healthier and a select pool compared to the working age sector of the general population. Insured people are typically better educated and have higher salaries than the working age group of the general working population. Generally, larger companies offer ancillary coverages to attract employees. Often, these employees are college educated and have higher salaries than the working, but uninsured population. Better educated and higher paid people are healthier and live longer. Companies strive to hire healthy employees, which is one reason employed people are a select risk compared to the general population. Hiring practices, including preemployment drug testing also improve the life risk. Drug testing requirements are becoming more commonplace, particularly for larger employers and companies in blue collar industries. Pre-employment drug testing improves the mortality risk of the group and provides some protection for the insurer. Finally, employees prove good health by being actively at work (AAW), a minimum number of hours a week. There are a number of reasons why the group life pool is a more favorable risk than both the overall general population and the uninsured working age population. Underwriters might consider reviewing the AAW policy wording and drug testing policy of prospective companies.
Group Life Mortality
The SOA has historically provided mortality studies based on the general population, but segregating group life data has more challenges and studies focusing on the insured population are not as frequent. In 2016 the SOA Group Life Insurance Experience Committee completed a study with a much larger amount of data than used in previous group life studies. The study included data from 15 group life carriers and comprised 97 thousand deaths and 45 million exposures for a four year period 2013-2017. The study excluded self-billed census and deaths, using list-billed census data only.
Some key findings include:
- The overall death rate for the insured population was 2.18 per 1,000. The mortality of the group life pool is 30-40% of the non-insured population at key working ages. What this shows is the group life death rate is much lower, essentially one third, of the death rate of the general population at working ages.
- The basic group life mortality rate dropped from 2.18 to 1.27 per 1,000 by face amount. Basic group life face amounts are often based on a multiples of salary so higher face amounts are generally associated with higher salaries.5 This shows that mortality improves as salary increases, likely driven by more access to health care, healthier diets, and increased exercise.
Connection between Income and Health
The positive relationship between income and good health is well established. People at upper income levels have better access to health care options, either through private coverage or employer-paid health insurance. Better educated people with more wealth, tend live in safer neighborhoods, have access to healthier food options, and have more opportunities for physical activity. Poorer people are generally lower educated, have less access to health care and if they are working, they often do not have employer-paid health insurance. Poorer people live in less safe communities, eat less expensive unhealthy food, and have less leisure time for physical activity.
Healthy behaviors of people with higher education and income is the primary driver of better mortality for that segment of the population. Better educated people understand the benefits of not smoking, exercise and nutritious food on improved health. People are swapping fruit juices, sports drinks and sodas for vitamin water, while replacing unhealthy snacks with nuts or whole fruits. At the same time, lower educated or poorer people often don’t have a full understanding of the effect of healthy behaviors. Even if poorer people understand the benefits of healthy behaviors, such as eating more nutritious food, they often do not have the income to spend on healthier, but often more expensive options.
Studies have shown that there is not just a widening income gap, but there is also a growing divide in diets. Dr. Dariush Mozaffarian, professor of nutrition at Tufts University, published a study that examined nutrition compared to income. Overall, he determined that Americans are eating better than 10 years ago, with the percentage of people eating what the study defined as a poor diet falling from 56% to 46%. However, the study did conclude that the quality of diet tracked in line with income. The majority of low income people, defined as making less than $30,000 a year for a family of four, were considered poor eaters. Just over 38 percent of low income people eat an intermediate diet, versus 62 percent of high income people, defined as making more than $69,000 per year for a family of four.6

Recent SOA studies of both the general population and the group life subset show that mortality improved with income. The January, 2019 SOA U.S. Population Observations referenced previously, included analysis of mortality based on income level in the U.S. population. The study period of 1999-2017 showed that age-adjusted annual mortality improvement for the top 15% Income earners improved 1.4% while the bottom improved just .6%. The study confirmed that there was annual mortality improvement for both high and low income brackets, but this occurred at a higher rate for the higher income cohort. However, the pace of divergence has slowed in recent years.4
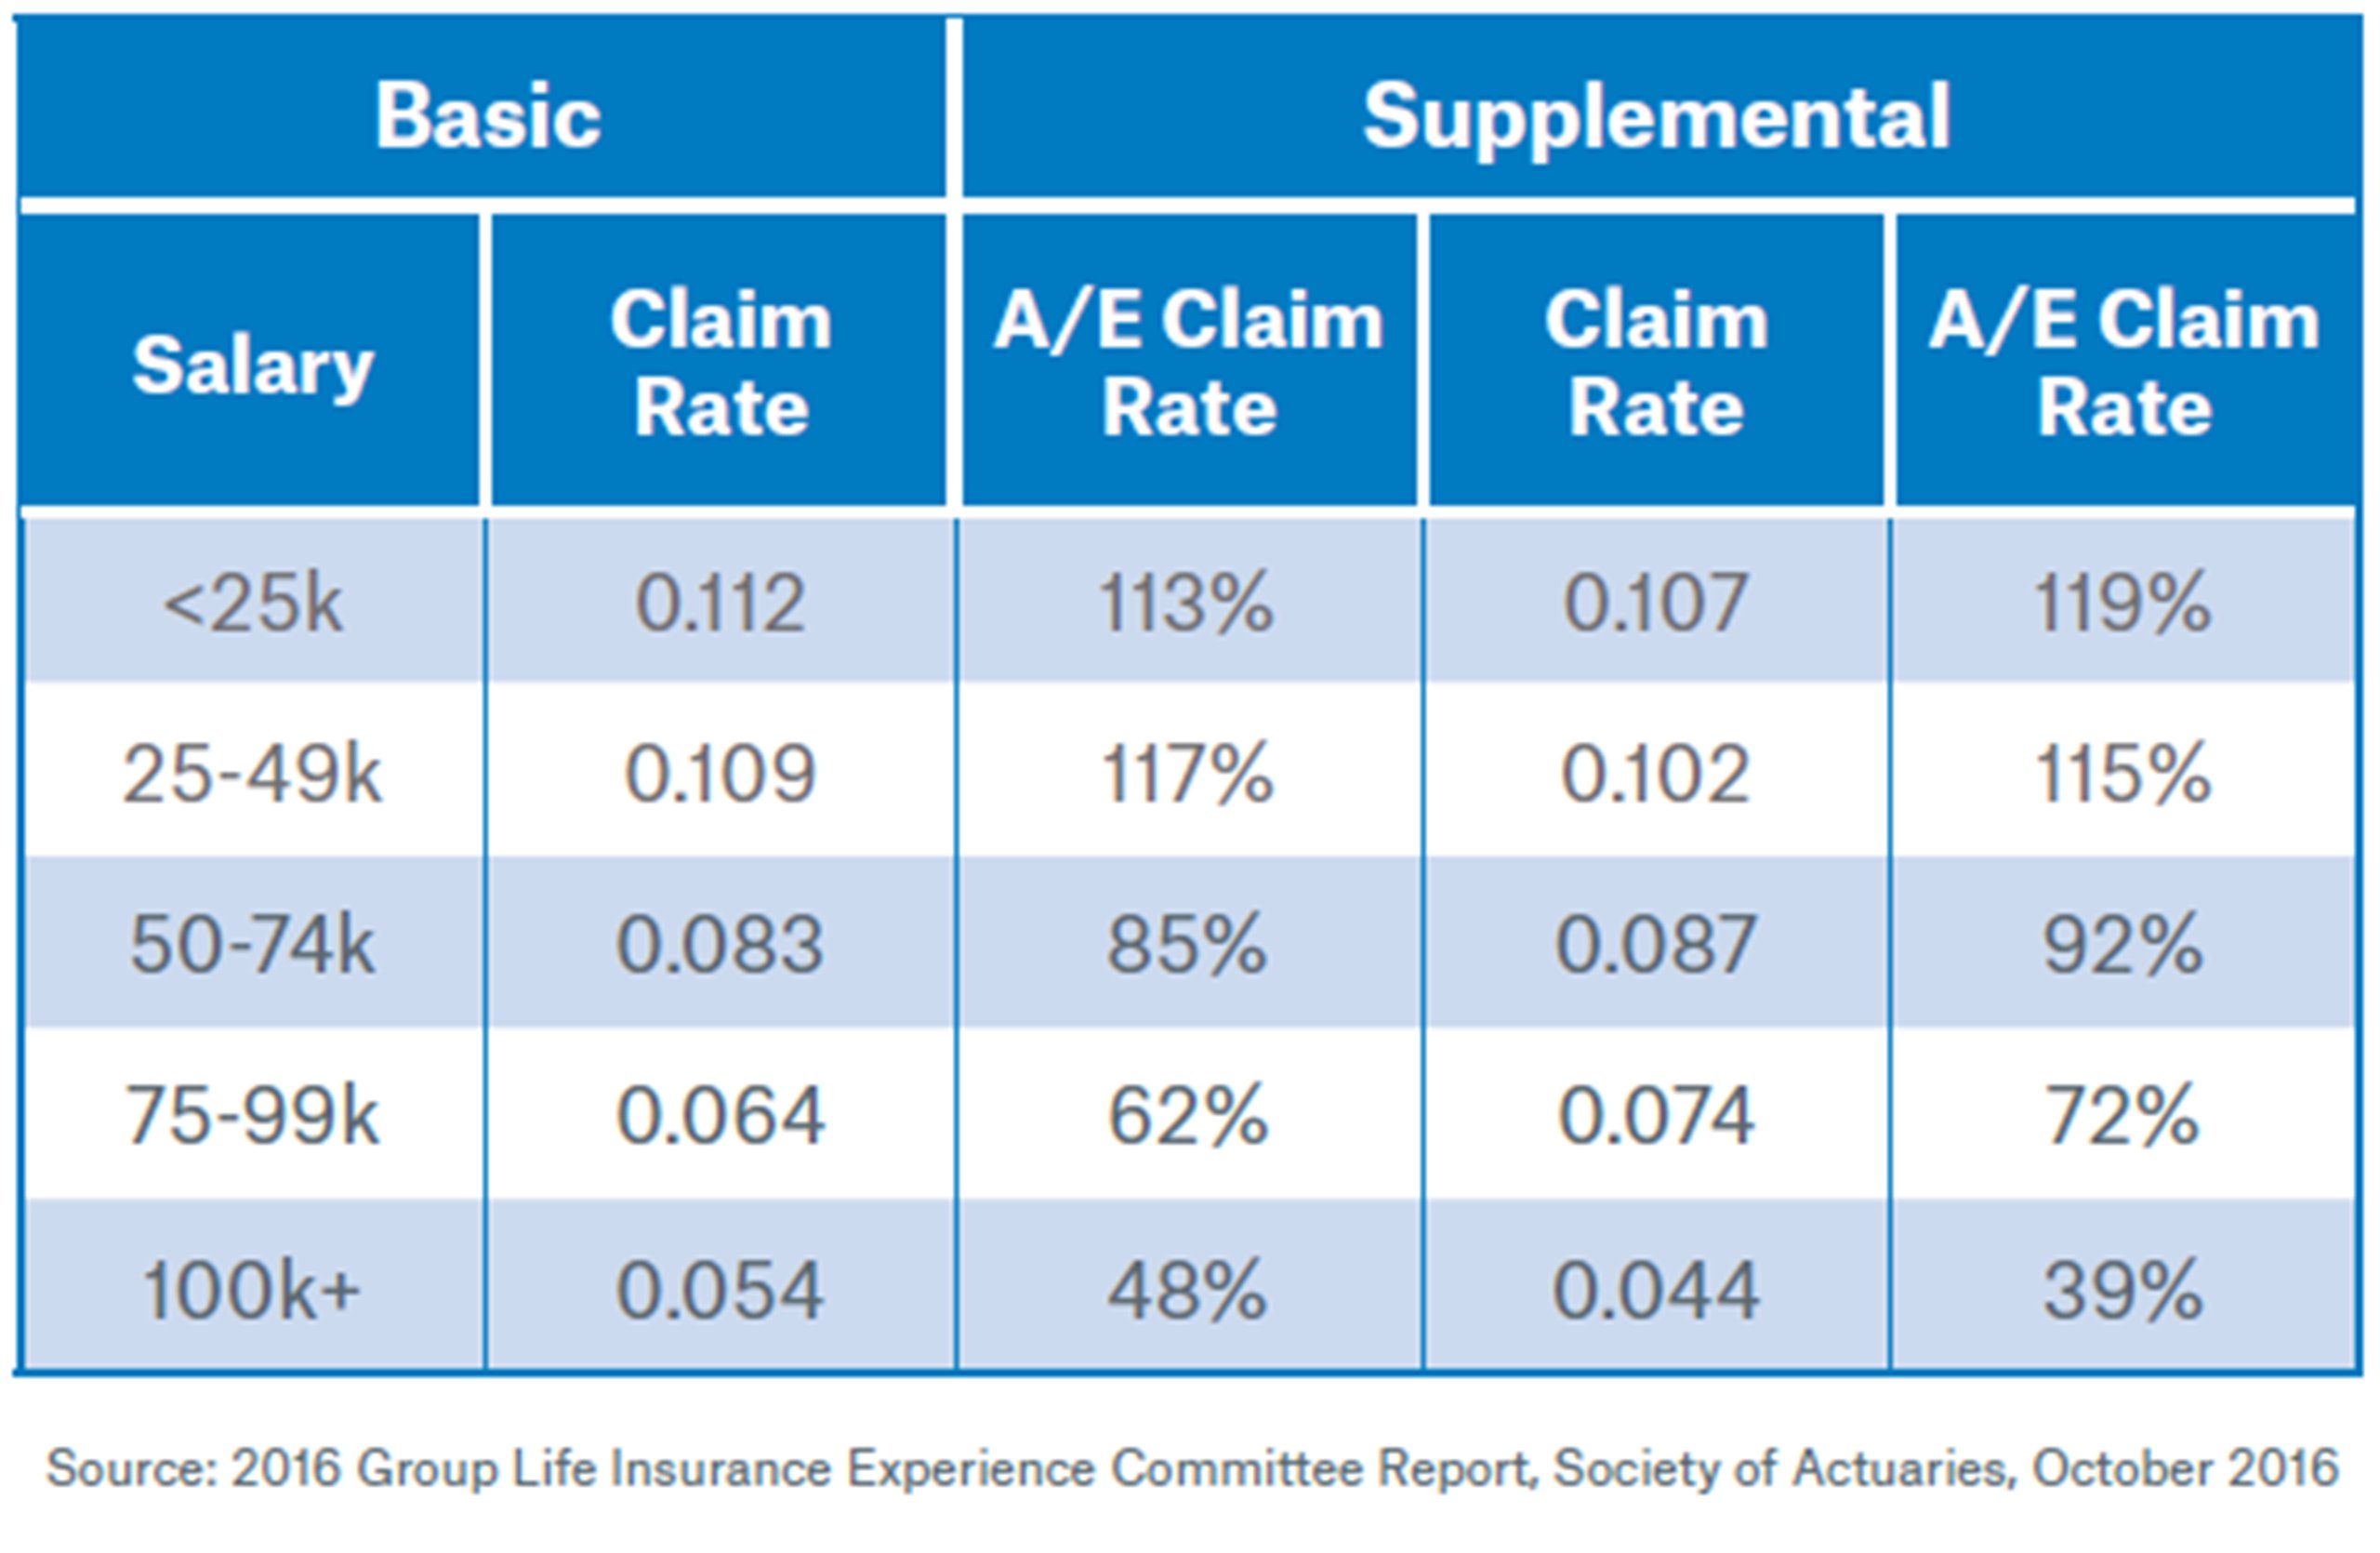
In regards to the group life population, the SOA 2016 group life committee study found that mortality improved as salary increased. Based on the graph below, the actual to expected (A/E) claim rate was compared for both basic and supplemental life. As a voluntary product, supplemental life has anti-selection risk, so the A/E claim rates are higher than for basic life which is employer paid and generally has full participation. However, Table 1 shows that mortality improvements with salary increases for both basic life and supplemental life were similar.5 Manual raters for most carriers consider some adjustment for either salary or face amount which considers the differences in death rates based on income. Underwriters should understand the criteria used in their company’s rating tools for calculating mortality at various income levels.

Mortality by Collar
The SOA 2016 group life committee study found death rates are in line with expectations in regards to occupation collar. For instance, the mortality for blue collar workers is worse than both grey and white collar workers. White collar workers are normally higher paid and better educated than both grey and blue collar workers. Carriers often focus marketing and sales attention on industries with morefavorable mortality characteristics typically found in white collar industries.
Based on Table 2, the actual to expected (A/E) Death Rate for blue collar is 118.4% as compared to 86.2% for white collar. Said another way, the blue collar business has 18% higher mortality than overall group life while white collar has 14% lower mortality than the overall group life data contained in this study. The expected claims rate adjusts for mix of age and gender.5 Industry or SIC code is a standard adjustment applied when rating group life business. There are expected percentages of blue, grey or white collar employees typical for companies in specific industries. Since there are significant differences in mortality based on occupation collar, the underwriter should confirm that the census occupations are consistent with other the collar makeup of similar companies in that industry.
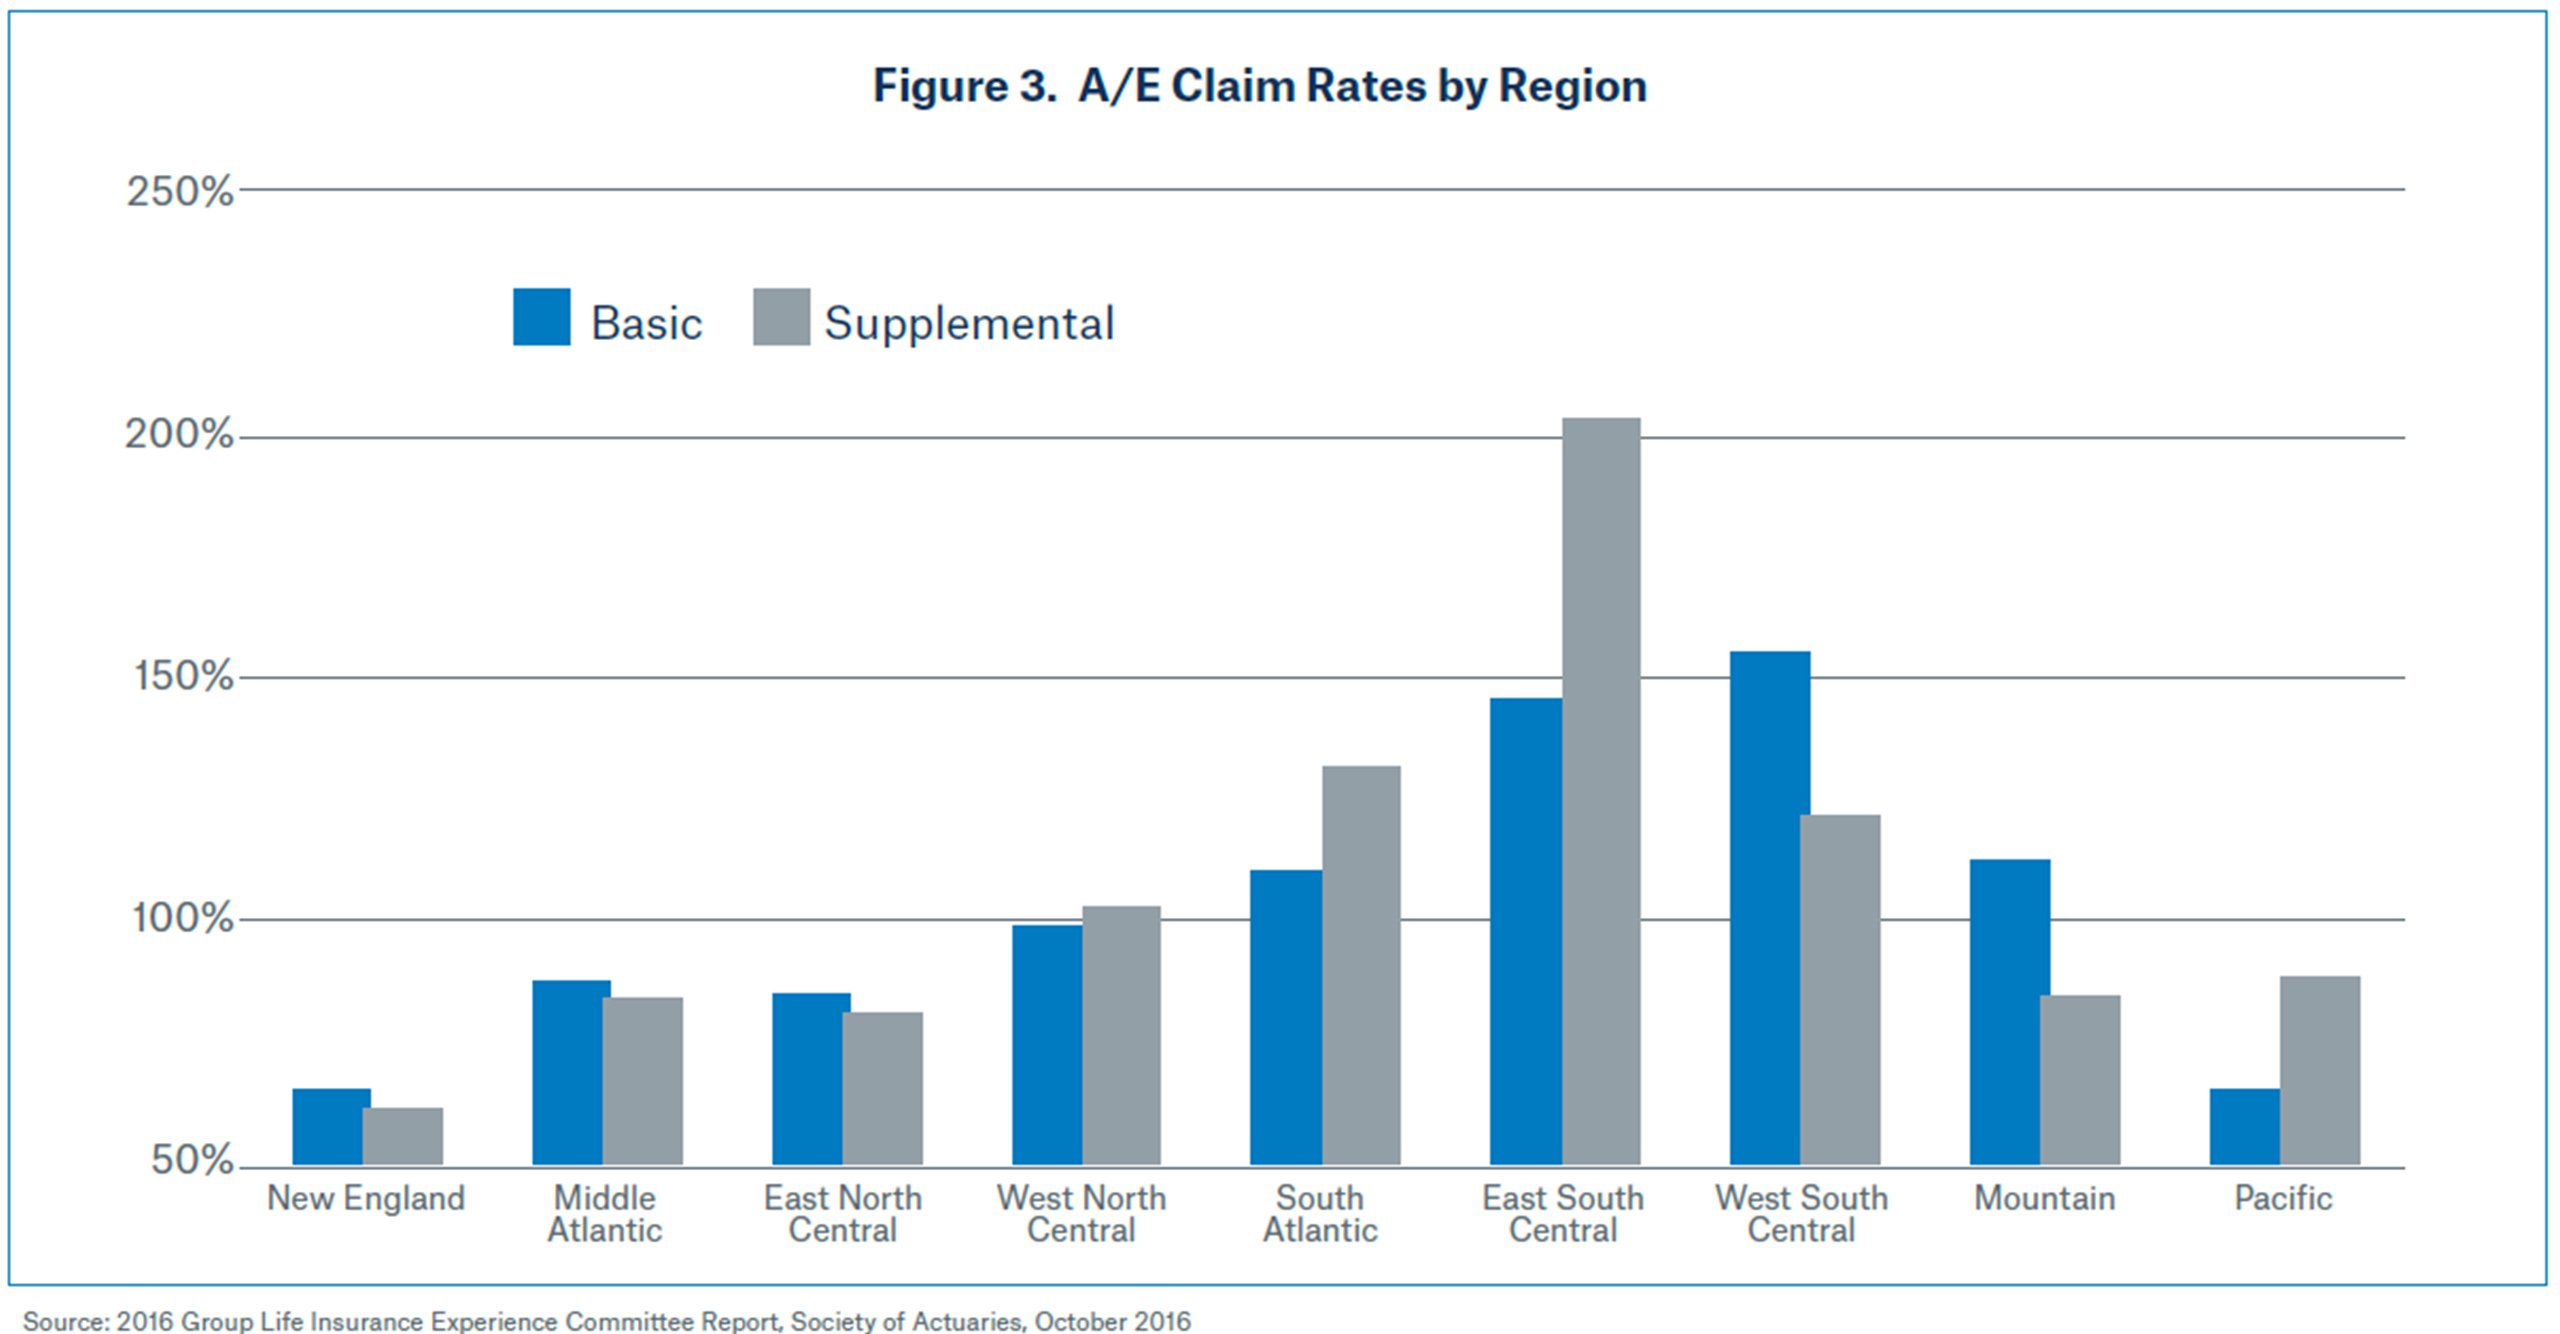
The overall mortality rate is significantly different between regions of the country. For instance, Figure 3 confirms that the Southeast region of the U.S. has the highest claim rate which is well above the expected claims rate of 100%. The New England region has lowest claim rate well below the expected claims rate and the Southeast. The primary drivers of mortality differences are likely due to income level and education differences in the regions. Mortality differences between regions, states, or even closely located cities can be significant and the underwriter should ensure that location factors are appropriately calculated. Most carrier’s manual raters include area factors, normally based on either state or zip code clusters. The situs address of the company is often used to determine the location or area factor. However, some carriers consider a blended adjustment, based on the estimated number of employees at various company locations.
Locaton and Mortality


Conclusions
Group insurers have typically targeted thriving companies in growth industries. Companies that are adding higher educated employees and improving their risk profile have historically been the marketing/sales focus of group insurance carriers. Current research supports a mortality gap based on demographics and other factors discussed in this paper. The competition to pursue growing companies in desirable industries with highly paid, college educated, white collar employees, is unlikely to change.
Manual raters have a number of components that derive a calculated rate based both at the per-person level and also applied to the overall group. Underwriters should strive to understand the mechanisms that drive their rating tools. With this knowledge, underwriters have a better understanding of how the rating tools calculated the recommended rate for the group. The underwriter should evaluate if the results from the rater have captured the particular risk characteristics of the group. Having this skill will help underwriters become more effective risk managers.
There are a number of publicly available sources for both mortality and company information that can be found with an internet search. The Society of Actuaries regularly publishes mortality studies both for the overall U.S. population and for the group life market. Other resources with abundant information and studies include the CDC, U. S. Bureau of Labor and the Census Bureau. In addition, extensive company information is available on both the company website and resources like AM Best.
Group underwriters are challenged to digest and evaluate wide-ranging information provided in the request for proposal. But taking the extra step to fully understand individual mortality drivers and to research the company specifics can be a difference –maker. Ultimately, making the most informed underwriting decision is crucial in creating a competitive edge.
Contact the Author:
/Richard%20Beckel.jpg/_jcr_content/renditions/original./Richard%20Beckel.jpg)
Related Content
Newsletter
properties.trackTitle
properties.trackSubtitle
