
Milliman Irix® Risk Score 3.0 with Medical Data and Credit Data
Stratifying mortality risk by combining prescription drug history, medical claims records, and credit data
properties.trackTitle
properties.trackSubtitle
Predictive models and life insurance
Executive summary
Milliman Risk Score with Medical Data and Credit Data is a proprietary scoring algorithm that combines prescription drug history, medical claims records, and credit data to predict the mortality risk of individuals relative to other individuals of the same age and gender.
In 2020, Munich Re assessed Risk Score 2.2, a score based on prescription drug history with the option to include credit data, and concluded that the scores are predictive of mortality for the U.S. insurance applicant population.1 In 2022, Milliman upgraded its Risk Score to incorporate medical claims data to produce the Risk Score 3.0 with Medical Data.2 Since then, Milliman further enhanced its Risk Score 3.0 suite to incorporate credit data so that carriers now have the option to use all three data sources in the Risk Score 3.0.
Milliman provided Munich Re with a dataset of 42 million lives sampled from the U.S. general insurance applicant population, including life, health, LTC, DI, final expense, and Medicare supplement lines of business. Life represents the majority of the dataset (64% of lives), followed by health (19% of lives). For each life in the study, risk scores were provided for the various data source combinations, including Prescription with Medical Data and Credit Data, Prescription with Medical Data, Prescription with Credit Data, and Prescription-only Data.
Munich Re analyzed the Risk Score with Medical Data and Credit Data and confirmed it is predictive of mortality for the U.S. insurance applicant population. The combination of Prescription data, Medical data, and Credit data provides greater mortality risk stratification insights as compared to the Risk Score with Credit Data or Medical Data only. The Risk Score with Medical Data and Credit Data model yields higher number of total scored lives, as well as provides greater exposure in the lowest and highest risk score bands, compared to other versions of the model using fewer data sources.
A company-specific insured population is not expected to have identical underlying characteristics as this insurance applicant population. Munich Re recommends that carriers interested in the Risk Score with Medical Data and Credit Data conduct a retrospective study on a company-specific applicant dataset to calibrate the tool to the carrier’s underwriting paradigm. This process will help carriers balance the score with the expected mortality of their unique target markets, distribution channels, and underwriting processes. For carriers already using a Prescription with Medical Data score or Prescription with Credit Data score, a Prescription with Medical Data and Credit Data combined score provides a more holistic assessment of mortality.

Methodology
Munich Re assessed the effectiveness of the new Risk Score with Medical Data and Credit Data in stratifying the mortality risk profile of a pool of 40 million3 applicants with entry ages 18 - 99. Juvenile lives were filtered out of our analysis as they were not scored under the Risk Score models incorporating credit data. The data provided included various versions of Risk Scores (prescription-only, prescription with medical, prescription with credit, and prescription with medical and credit combined scores) on a scale of 0 to over 100. Each life entered the study between the first quarter of 2005 and the last quarter of 2020. Deaths were sourced from a reliable third-party source of death data. The study population was comprised of 1.7 million deaths out of 224 million exposed life-years.
The expected mortality basis was taken from the 2015 VBT primary select and ultimate age-nearest birthday tables split by age and gender with a 1 percent mortality improvement. Applicant smoking status was not provided, so an 85 percent non-smoker/15 percent smoker blend of the smoker distinct tables was used.
Munich Re completed additional analyses of relative actual to expected mortality ratios (A/E) by various factors (e.g., hit type, age, and gender) to assess whether the mortality risk stratification by the Risk Score with Medical Data and Credit Data is influenced by those factors.
Results
Overall results
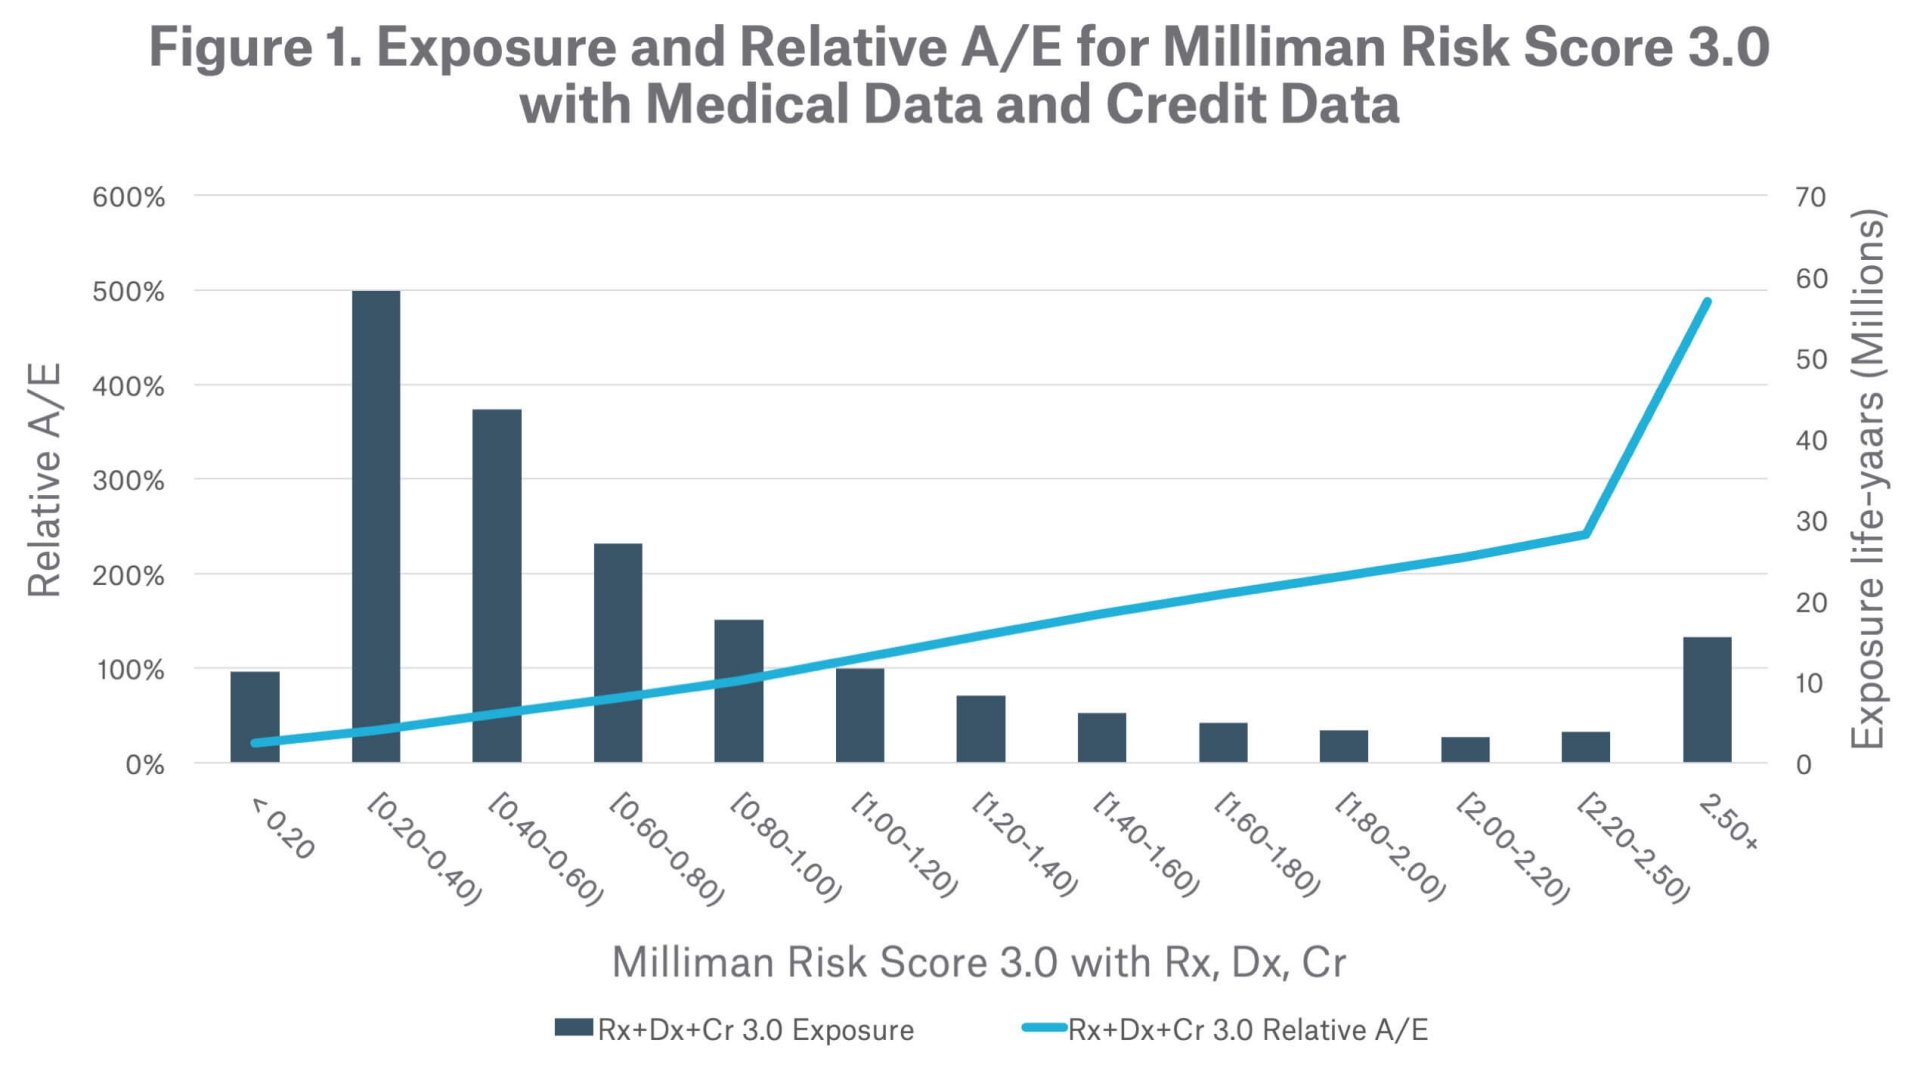
Exposure

Comparison between Risk Score Models


Use Case – accelerated underwriting triage tool

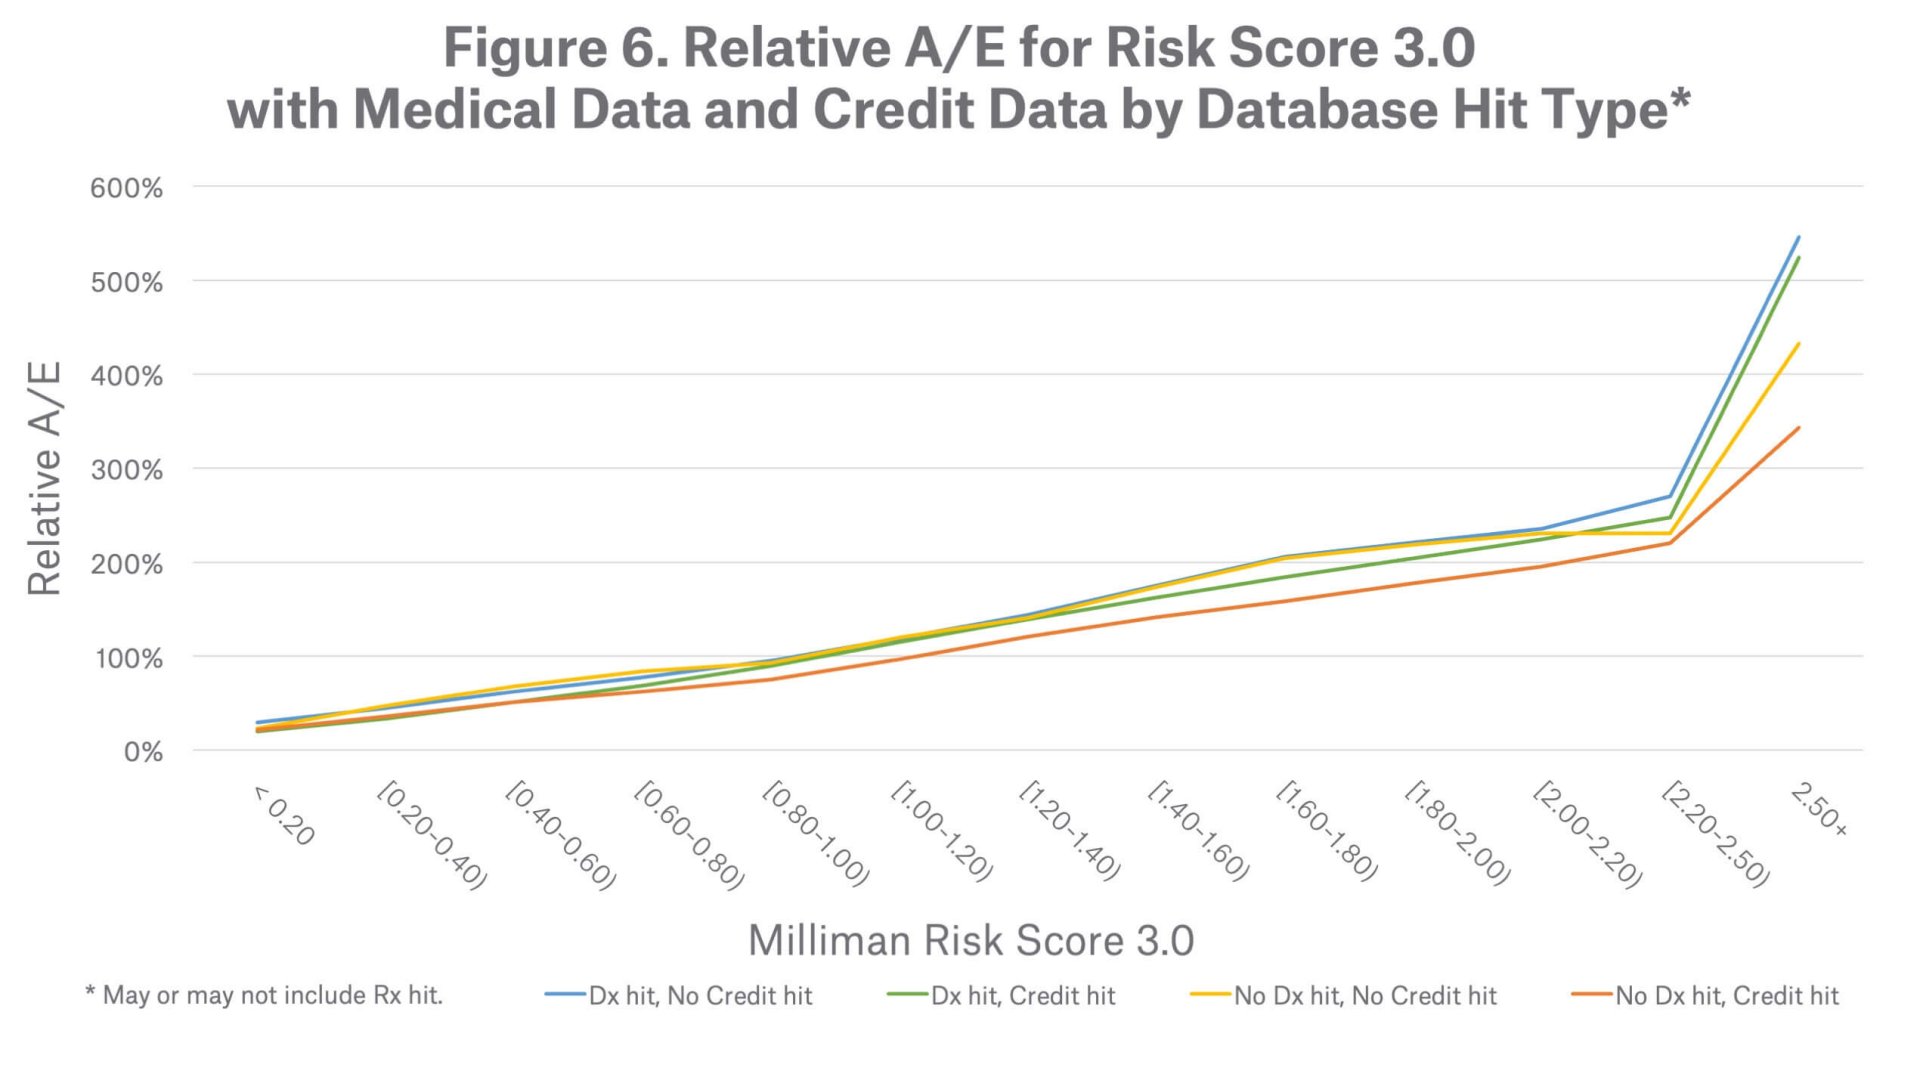
Database hit type

Age
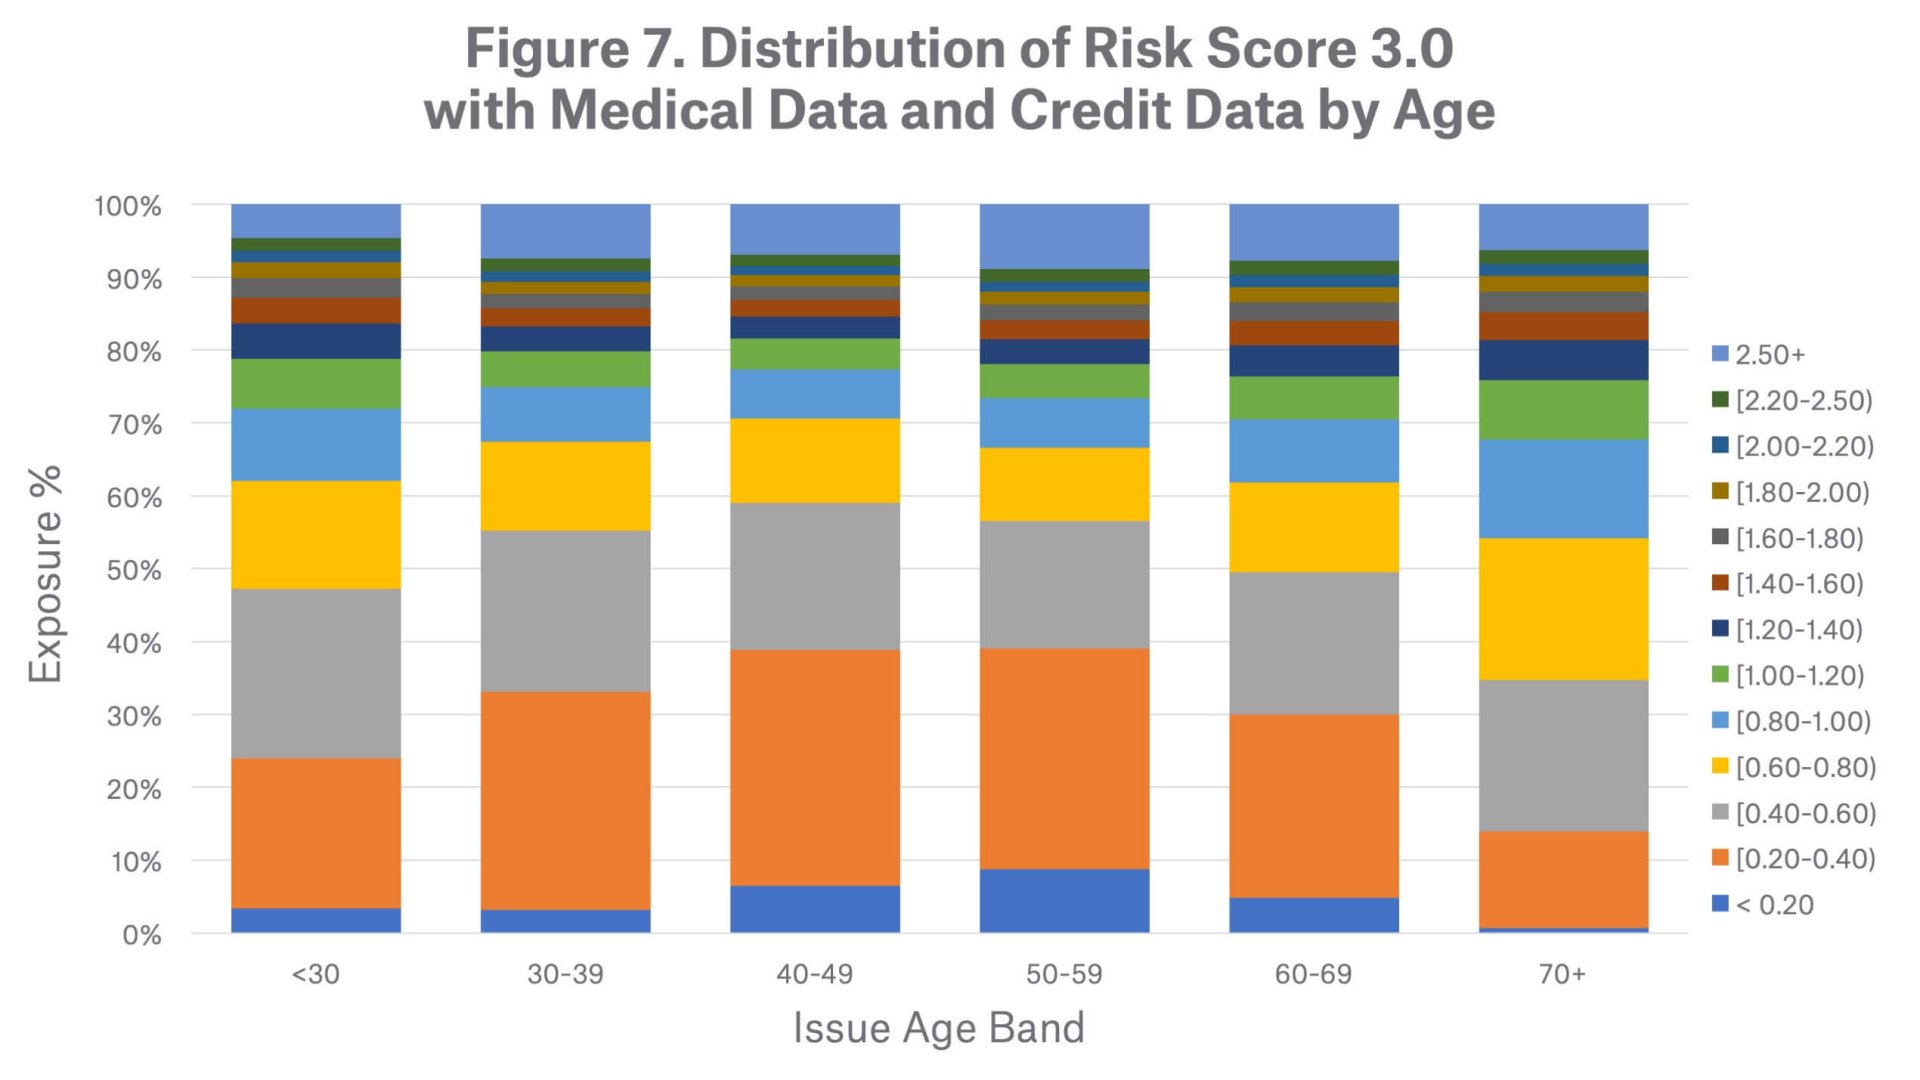
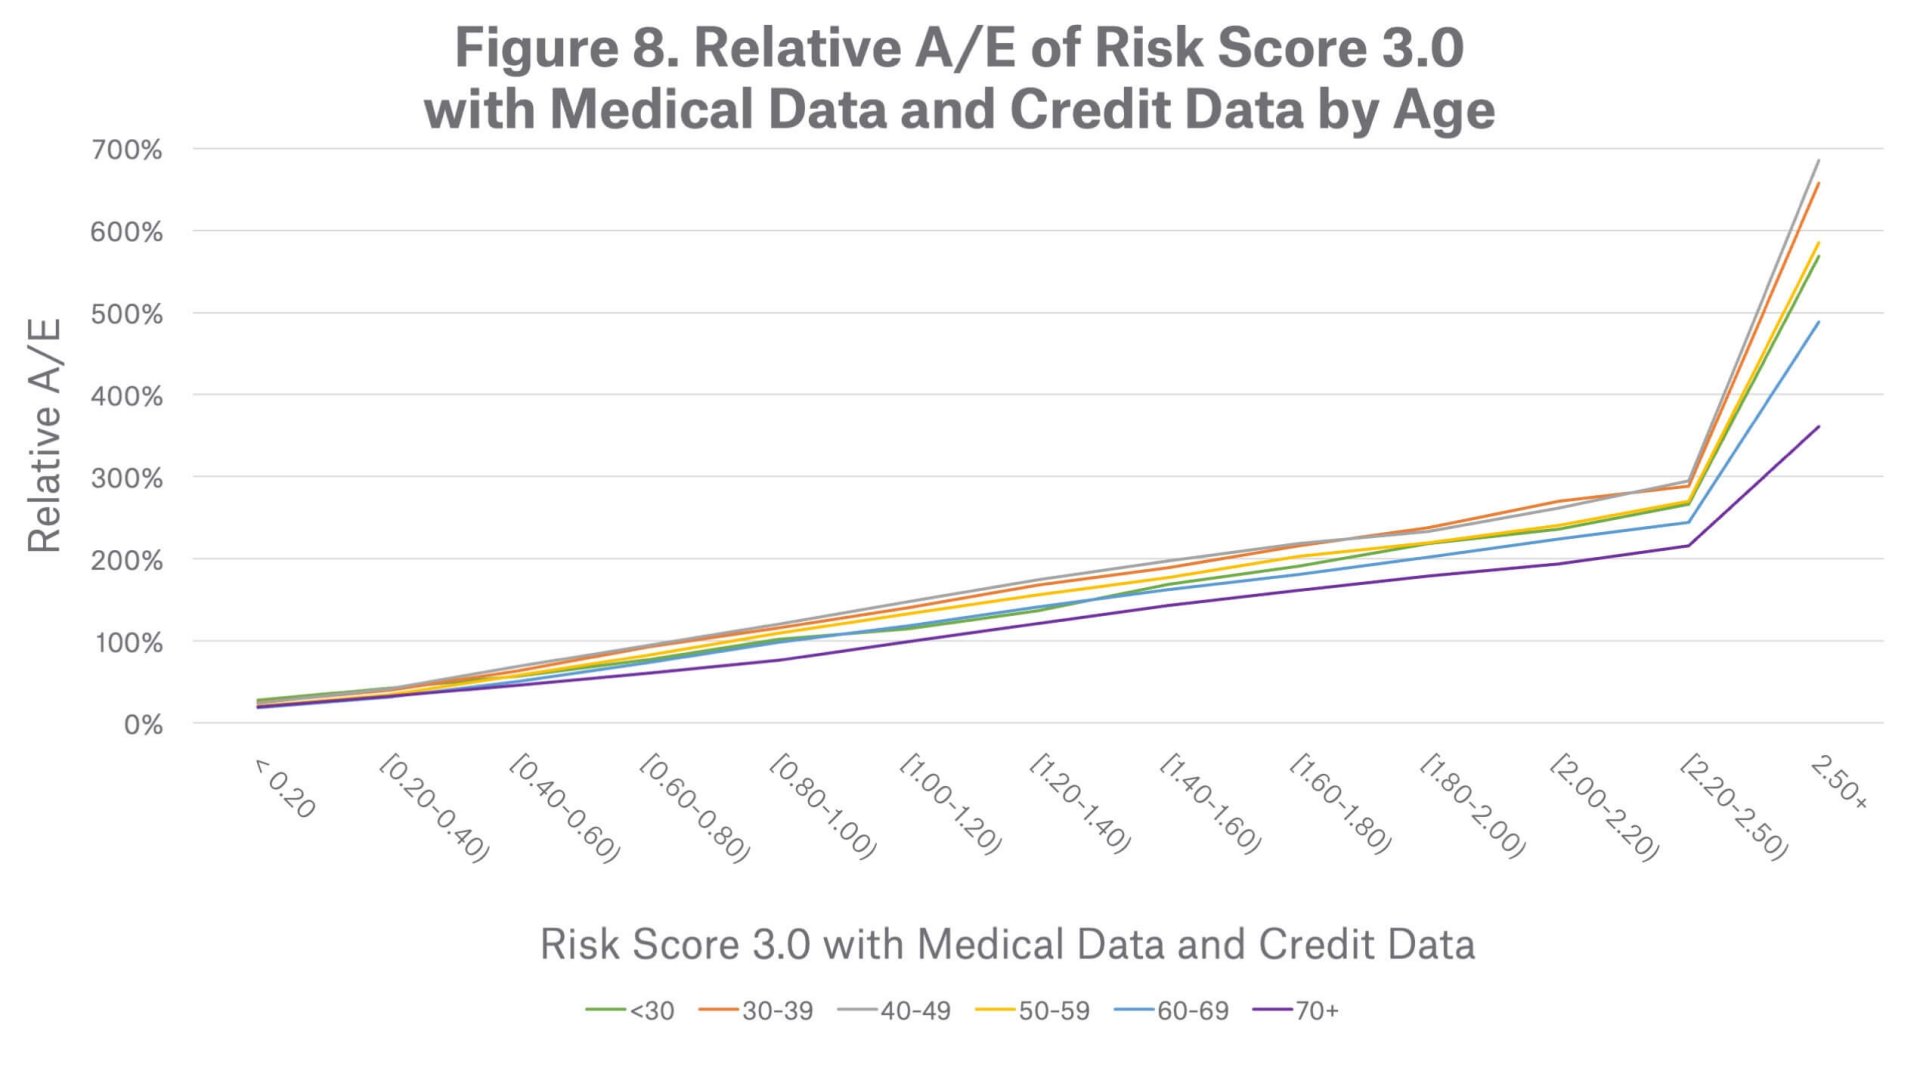
Figure 8 demonstrates the mortality risk segmentation of the Prescription with Medical Data and Credit Data score by age group. All age groups follow a similar mortality stratification pattern, where mortality risk increases as scores increase. The chart shows that the score is particularly effective at segmenting mortality for ages 30 to 59.
When considering breakdowns by gender, the mortality segmentation pattern also looks similar across both males and females.
Bias Testing
Summary
Munich Re concludes that the Milliman Risk Score with Medical Data and Credit Data is an effective predictor of mortality for the U.S. insurance applicant population. Compared to earlier versions of the Risk Score based on fewer data sources, the Risk Score with Medical Data and Credit Data increases the volume of scored individuals and more effectively stratifies mortality risk. A score is provided for an individual with prescription history only, medical claims record only, credit data only, or any combination of the 3 data sources. While mortality segmentation is effective across all of these data combinations, the Risk Score is most effective at identifying high mortality risk when medical claims data hits are present. In the context of a fluid-less underwriting triage tool, the Prescription with Medical and Credit score provides better risk segmentation with more lives scored than earlier versions of the Risk Score, allowing carriers to achieve higher STP with better mortality.
Finally, a company-specific insured population is not expected to have identical underlying characteristics to this insurance applicant population; we recommend that each carrier perform a retrospective study, including bias testing, to best assess the value and application of the Risk Score with Medical Data and Credit Data. Munich Re can assist carriers in structuring bias testing, evaluating the retrospective study and advise on ways to incorporate Milliman Risk Score with Medical Data and Credit Data into their underwriting process.
