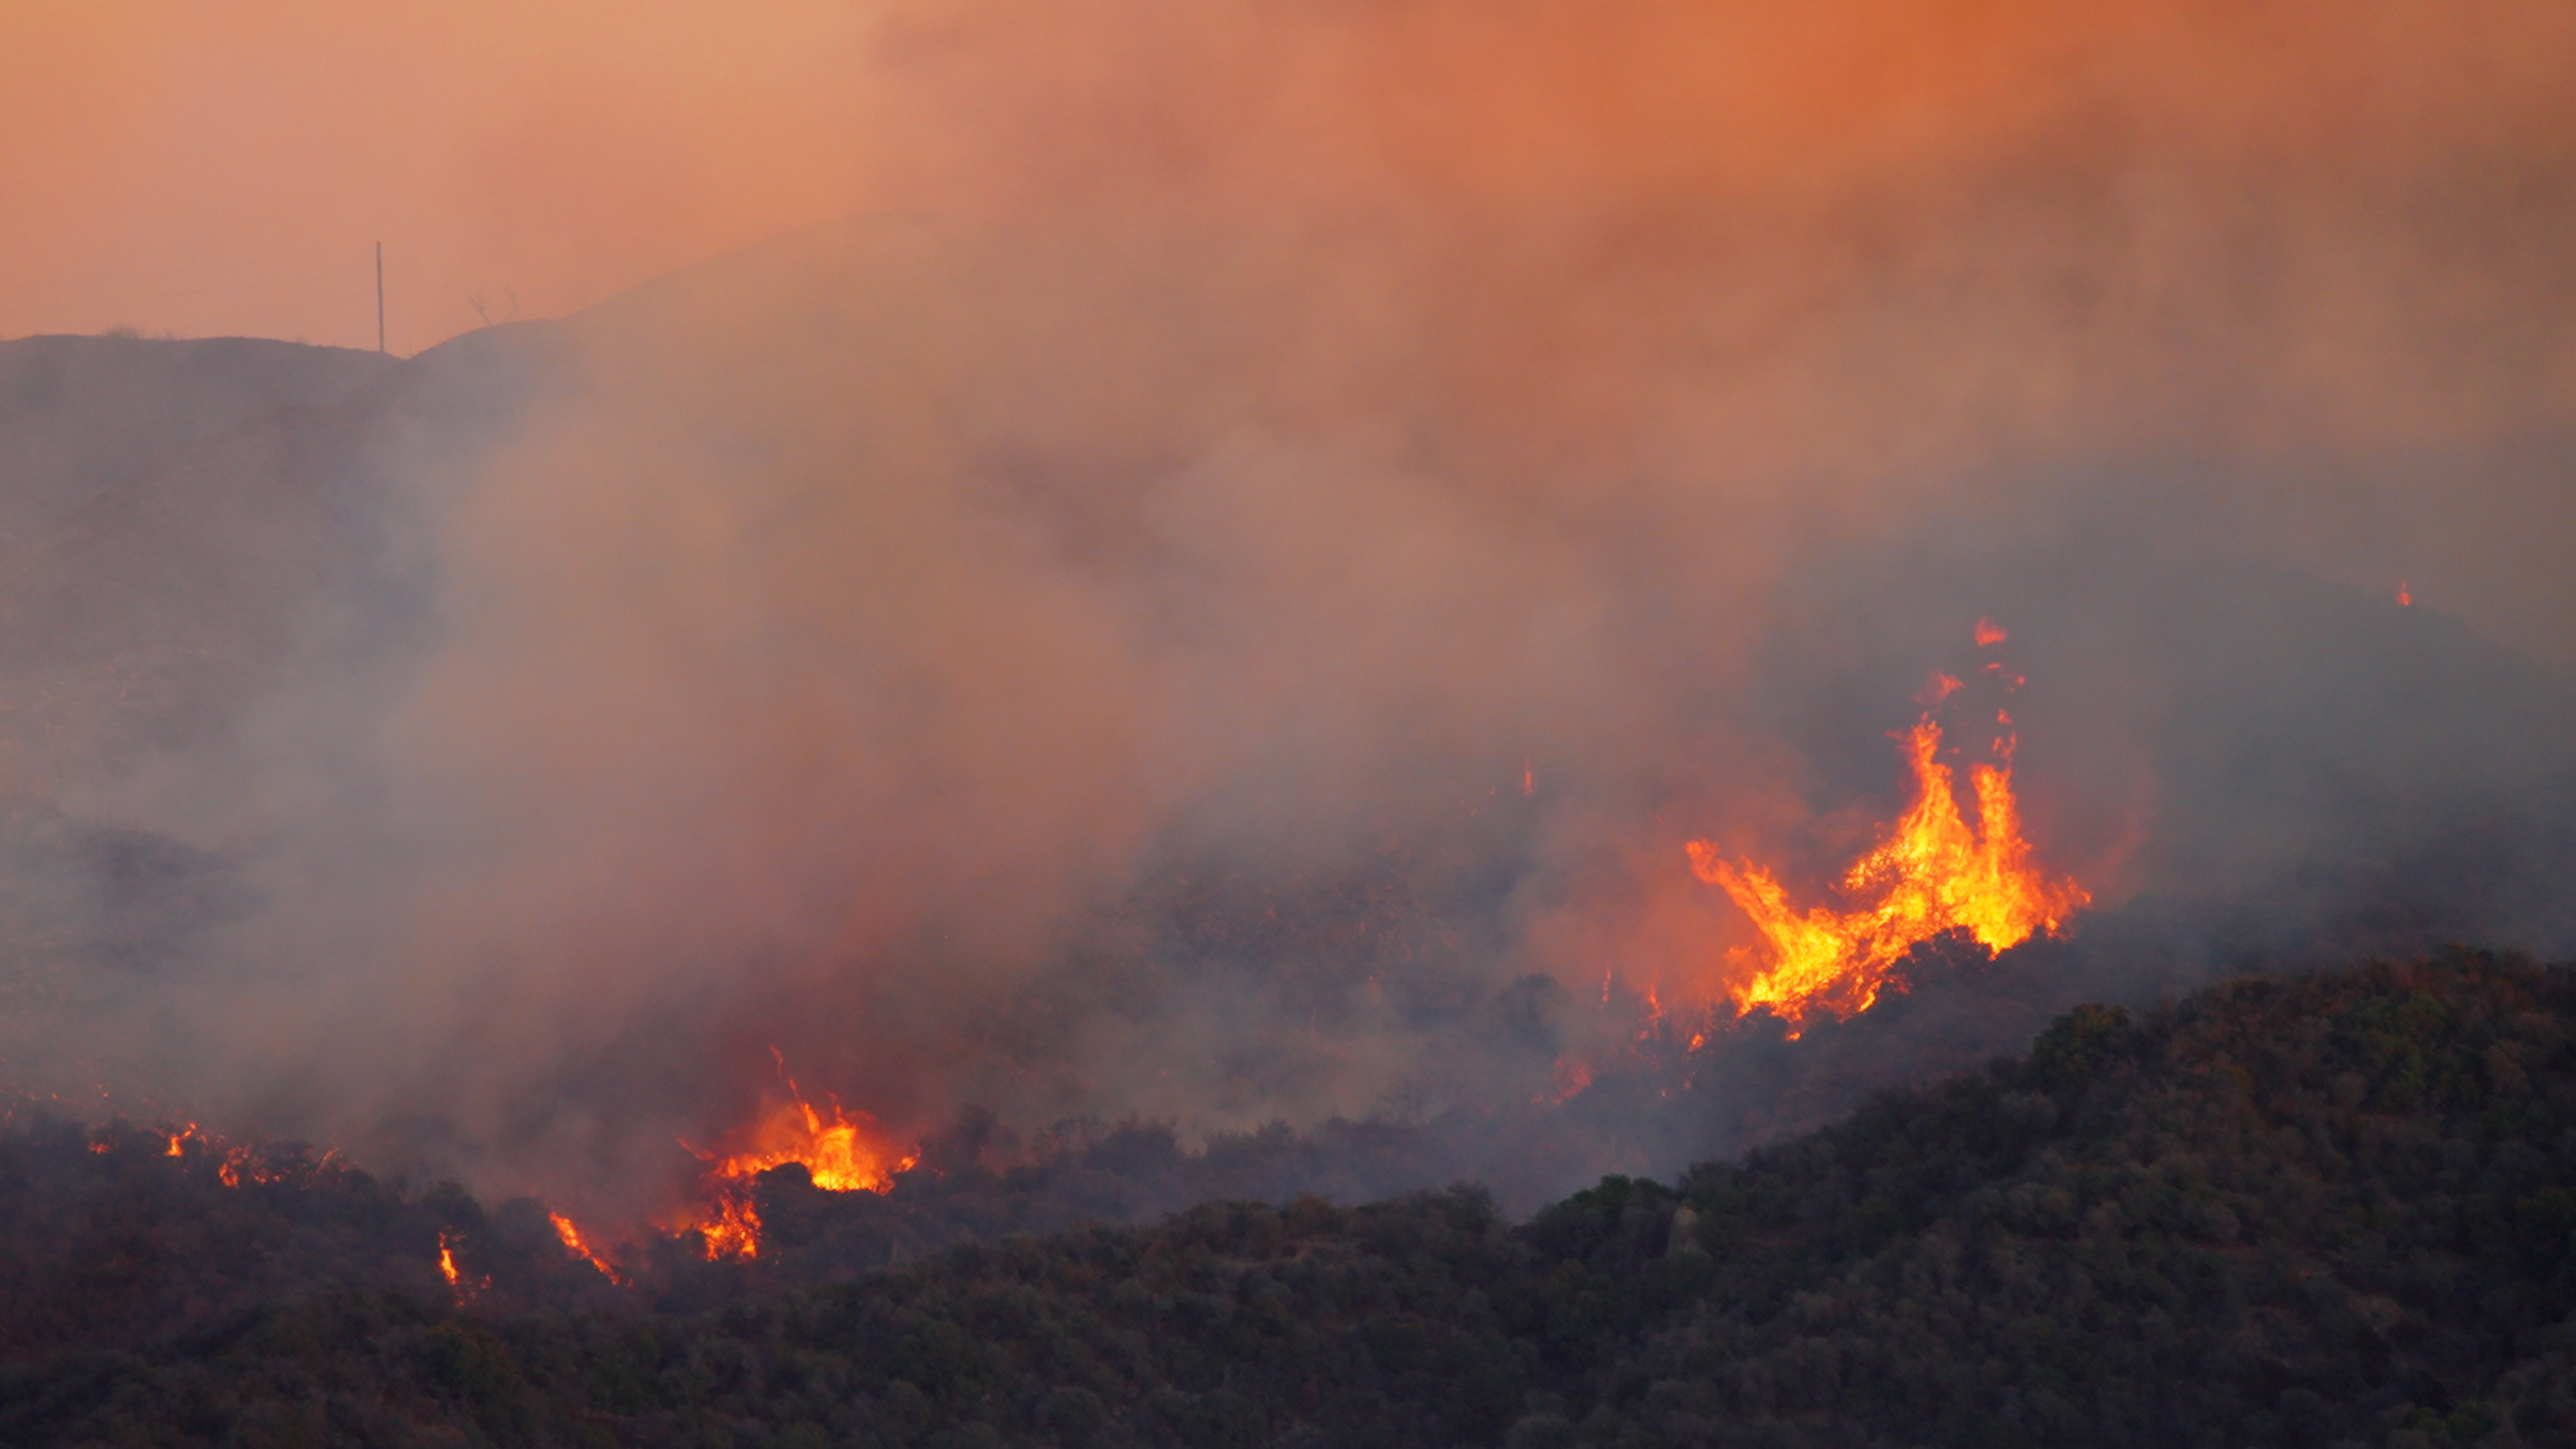
Weather disaster losses have risen relative to national income in many major economies. Despite considerable volatility, nearly two-thirds out of a sample of 20 countries recorded higher average annual losses from floods, storms, hail and wildfires relative to national income over the past 10 years compared to the first ten years of this analysis (1986–1995).
On the occasion of the COP 31 global climate summit in Türkiye, Munich Re analysed overall losses from weather-related disasters relative to gross national income (GNI) in 20 selected countries over the past 40 years. The sample included selected major industrialised economies and middle-income countries.
The main findings of the analysis:
- In 13 of the 20 countries analysed, weather disaster losses accounted for a higher average annual share of GNI over the past ten years (2016–2025) than in the first ten years of this analysis (1986–1995). These countries are (in alphabetical order): Australia, Austria, Brazil, Canada, France, Germany, Italy, Japan, New Zealand, Portugal, Spain, COP-31 host Türkiye and the United States. It merits mentioning that the volatility of the results over the complete timeframe of the last 40 years is significant in many countries.
- In the last five-year period (2021–2025), eight countries recorded their highest five-year average: the United States, New Zealand, Australia, Germany, Canada, Spain, Italy and Brazil. Ratios ranged from almost 0.2% in Brazil to more than 0.5% in the United States. The numbers indicate an elevated loss burden relative to GNI in these countries, though the development was not consistently upward due to benign years or extreme events.
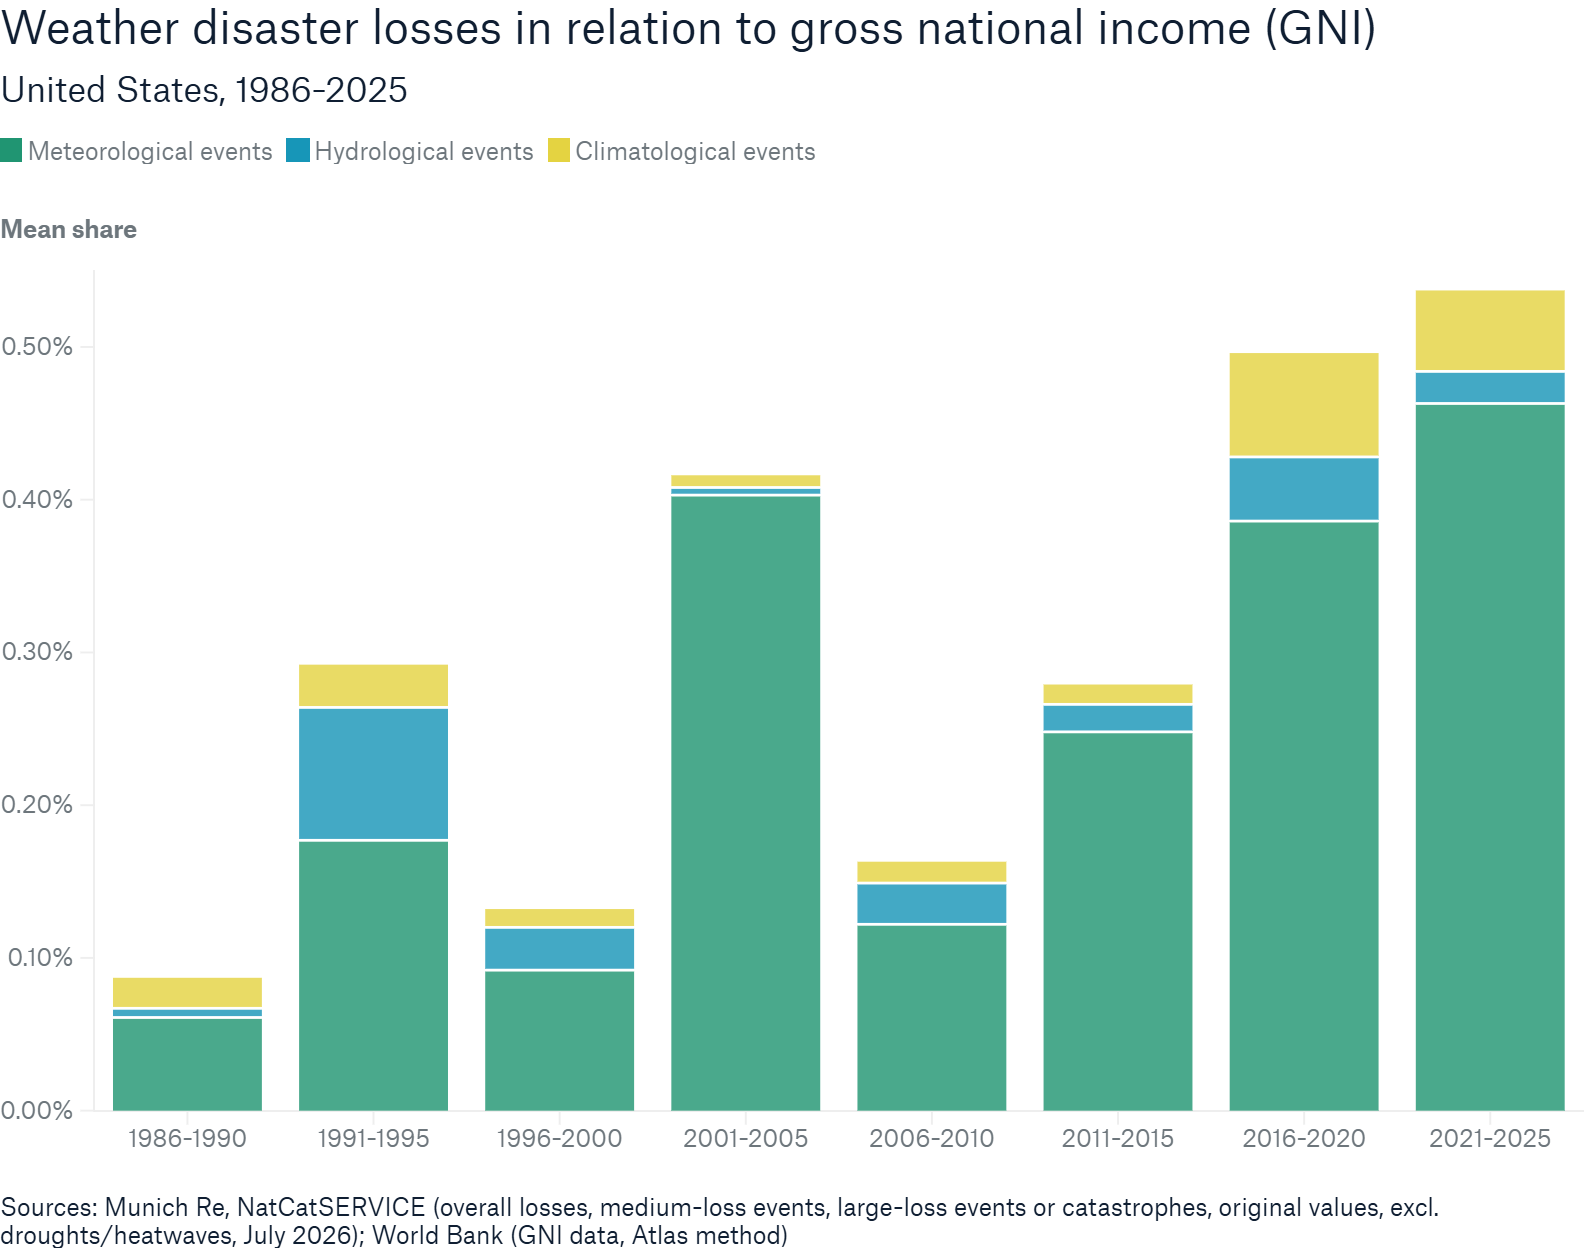
- The United States recorded the highest loss/GNI ratio of all countries in 2021–2025. Weather-related natural disasters cost more than 0.5% of GNI per year on average in the US in the last five-year period. Given the scale of the world’s largest economy, this also illustrates the substantial economic losses caused by weather-related disasters in the US each year. New Zealand also stood out with a very high ratio in the last five years; the other countries with the highest loss/GNI ratios in 2021–2025 were Australia, Germany and Mexico.
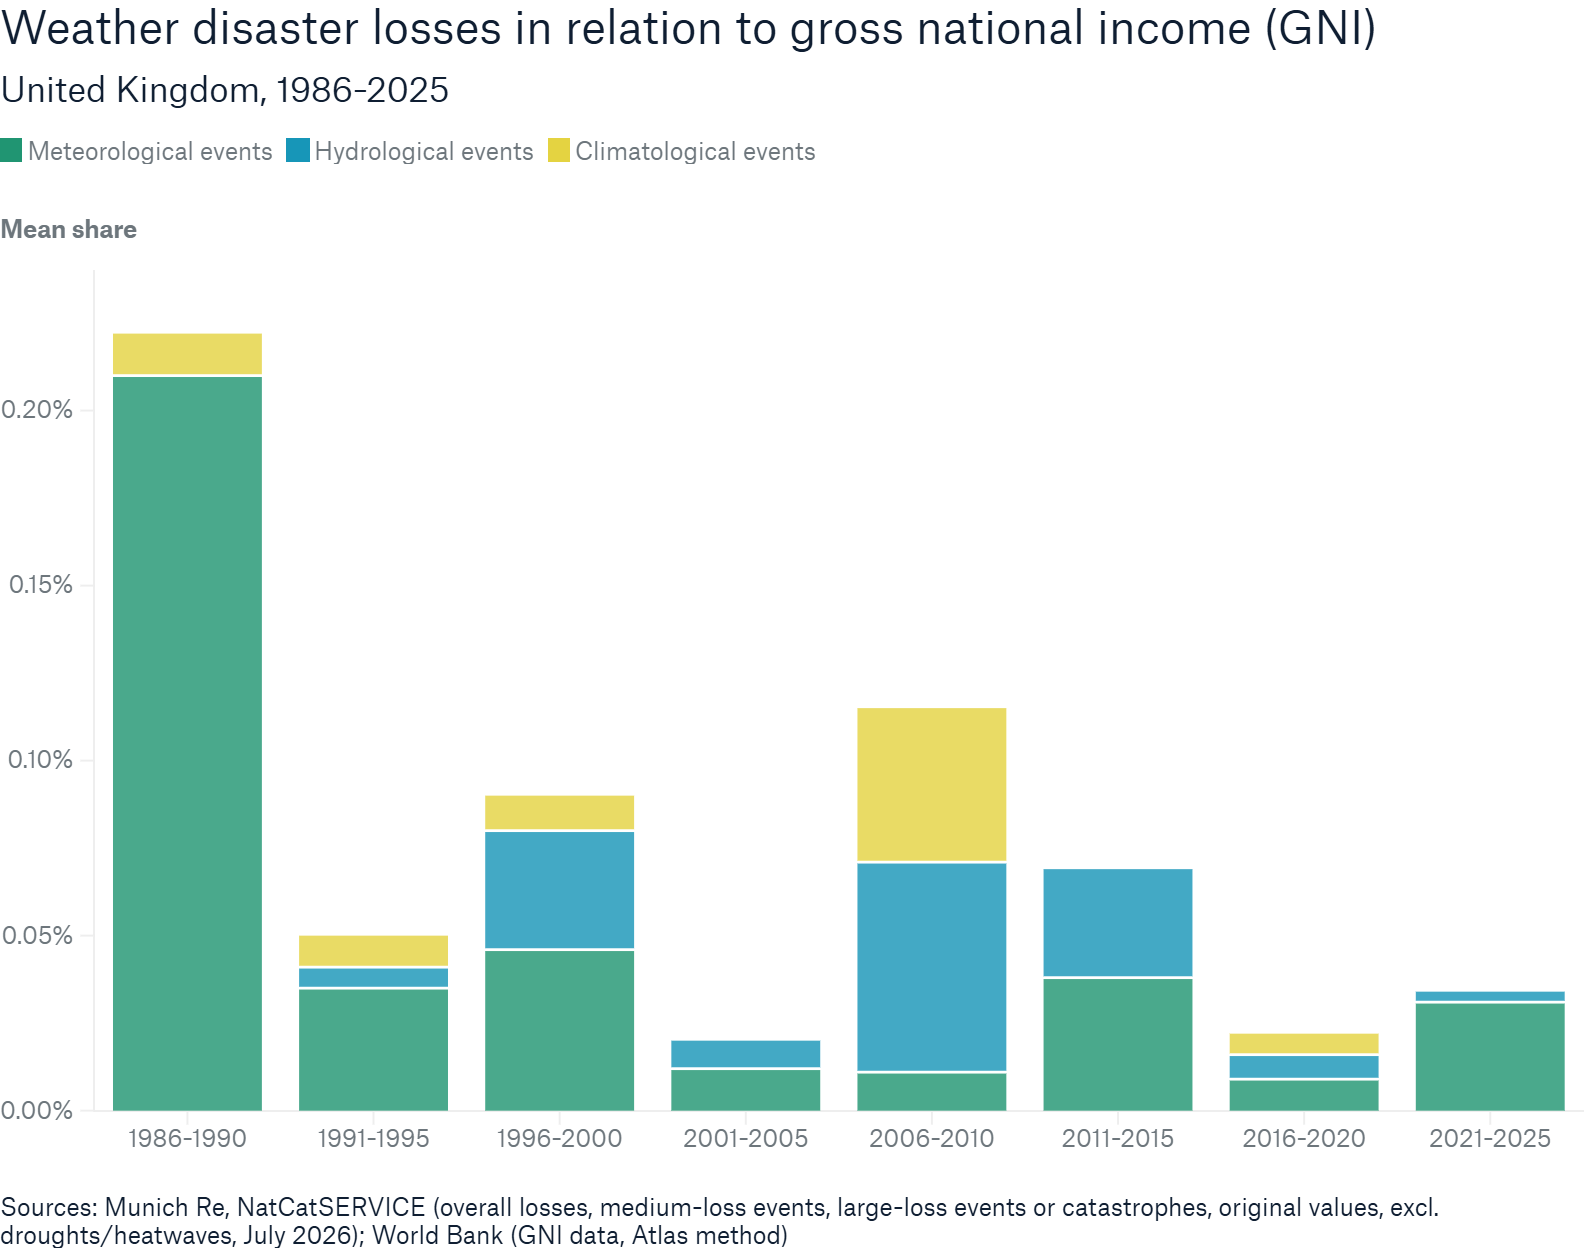
- The picture differs in some countries. Japan and Thailand experienced large fluctuations dominated by major single events. The Netherlands and the UK recorded lower loss/GNI ratios than at the start of the analysis. In the UK, this was partly due to rising nominal GNI: even in 2006–2010, when average annual losses were at their highest, they were lower in relation to GNI than in 1986–1990.
GNI has risen dramatically in India and China over recent decades, significantly affecting their loss/GNI ratios. China at the same time has invested substantially in flood protection along major river systems flowing through many megacities, which might have helped to limit losses. Strong disaster resilience in Switzerland and especially in Japan may also have had a loss-mitigating effect, but its impact on these ratios cannot be determined from this analysis. - Across the 20 selected countries combined, the share of recorded weather disaster losses that remained uninsured fell from approximately two thirds in 1986–1990 to half in 2021–2025 on average. The change was not continuous, and the aggregate is influenced by where major disasters occurred. It therefore does not demonstrate a uniform improvement in insurance coverage or affordability. Even in the latest period, around half of overall weather disaster losses remained uninsured. Prevention and adaptation play a different but complementary role. They can reduce physical damage and, where effective, support insurability. Strengthening prevention and adaptation, reducing exposure and vulnerability, and improving financial protection are therefore important elements of disaster resilience.

A small percentage of national income can sound abstract, but behind these figures are damaged homes, businesses and infrastructure worth billions of dollars. Prevention and adaptation can reduce damage before it occurs, while insurance can help households, businesses and economies recover from losses that cannot be prevented.
Measuring the relative loss burden
The analysis does not separately measure changes in weather hazards, economic exposure, vulnerability or the effects of climate change. However, wider scientific research shows that climate change is increasing the likelihood or intensity of many weather extremes in different regions.
For each year, Munich Re calculated weather disaster losses as a percentage of that year’s GNI, using original nominal values. These annual ratios were then averaged over five-year periods to make longer-term comparisons easier. This measure, referred to as the relative loss burden, indicates the scale of weather disaster losses in relation to national income. A rising relative loss burden can reflect higher disaster losses, lower national income or a combination of both. Conversely, a declining burden does not necessarily mean that disaster losses have fallen: economic growth can reduce the ratio even when losses remain substantial. Individual major disasters can also strongly influence five-year averages.
Regional deep-dives: the results for the 20 selected countries in detail
Americas
The United States carried a relatively high weather-related loss burden across several periods. The ratio peaked at more than 0.5% on average in the 2021–2025 period, reflecting the country’s exceptionally high overall disaster losses. Meteorological losses accounted for around 85% of the latest ratio. Rather than reflecting a single event, the peak resulted from the accumulation of major losses – including Hurricanes Ida (2021), Ian (2022) and Helene (2024); the 2025 Los Angeles wildfires; and high and rising thunderstorm losses. All in all, this meant losses were economically significant despite the country’s exceptional national income.
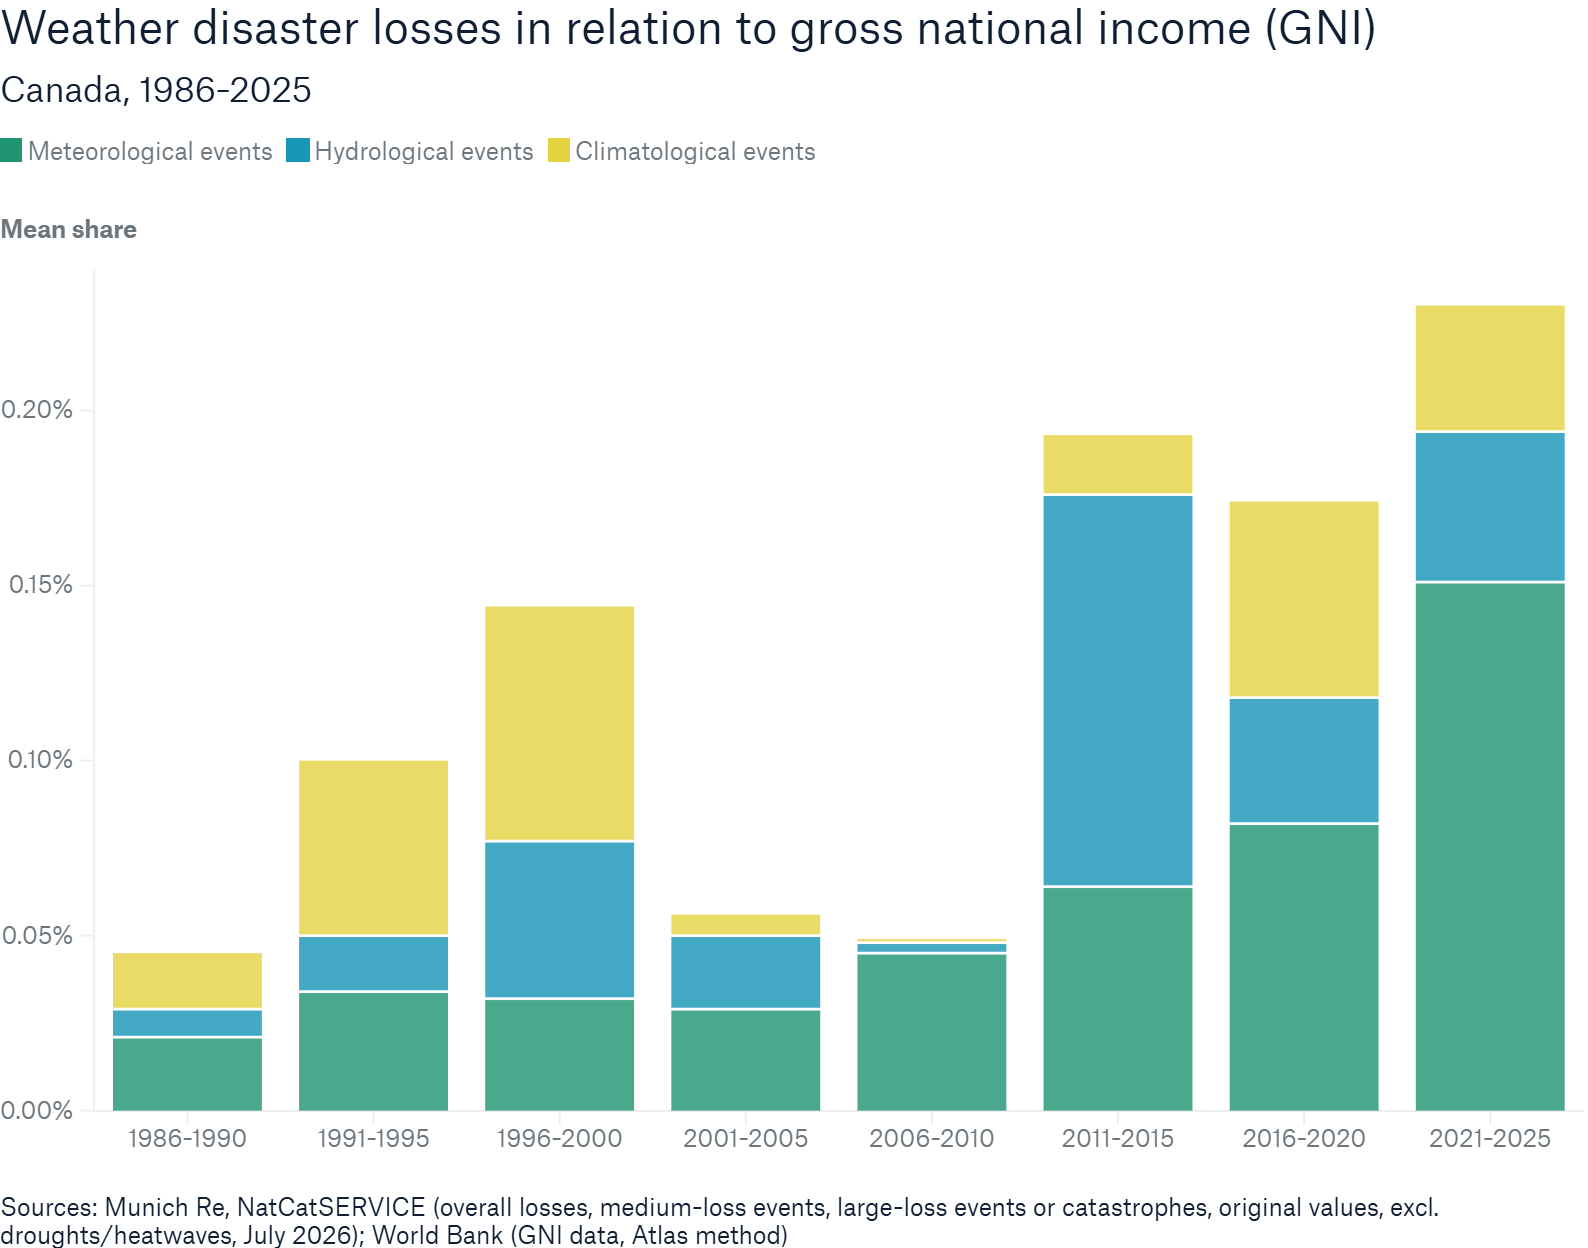
Canada’s average annual loss burden remained elevated, fluctuating slightly after 2011, before reaching a new high of more than 0.2% in 2021–2025. Meteorological losses dominated and caused roughly two-thirds of the weather disaster losses in the last five-year period, followed by hydrological and climatological events. Major drivers included both Hurricane Debby and a severe hailstorm in Alberta in 2024.
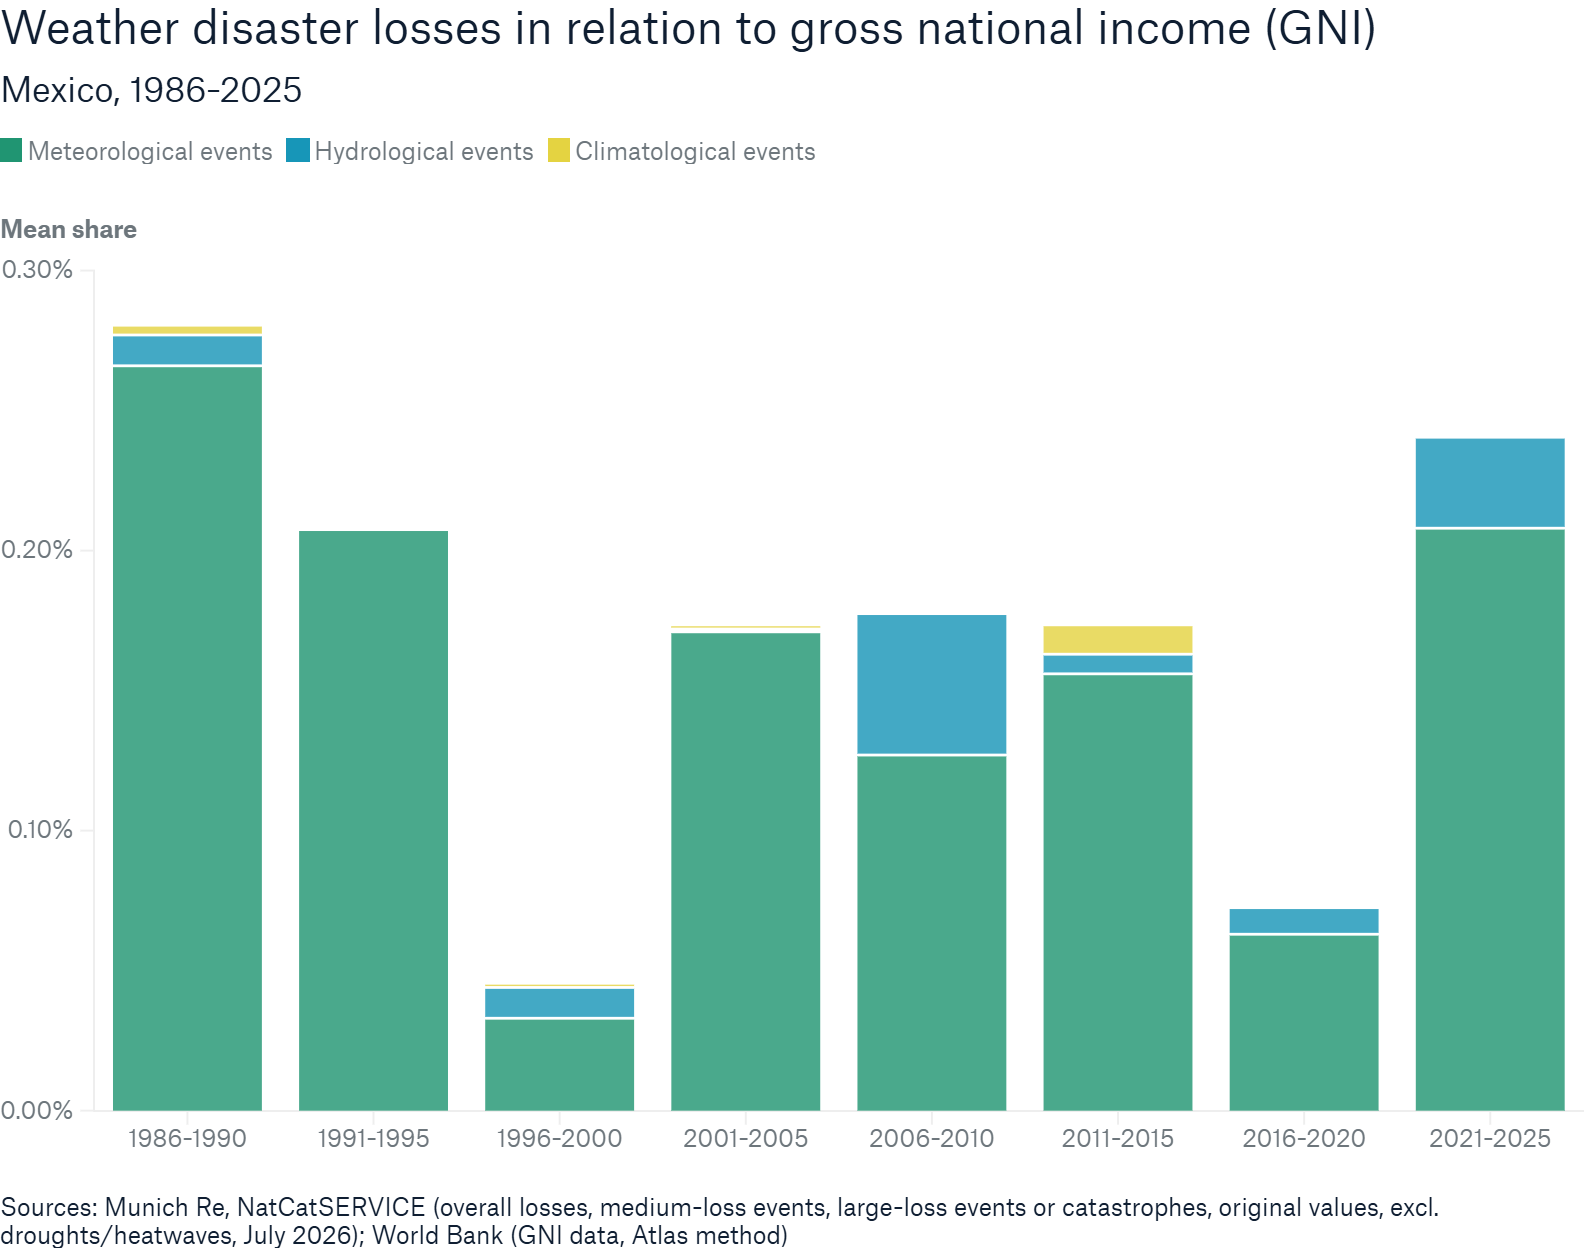
Mexico’s relative loss burden reflects recurring tropical cyclone and flood losses. Mexico's early peak was overwhelmingly driven by meteorological losses in 1988, particularly from Hurricane Gilberto. Combined with Mexico’s comparatively low GNI at the time, these losses represented a greater relative burden. The latest five-year ratio was likewise elevated, with Hurricane Otis severely damaging the holiday resorts of Acapulco in 2023 and thus strongly impacting the five-year average losses.
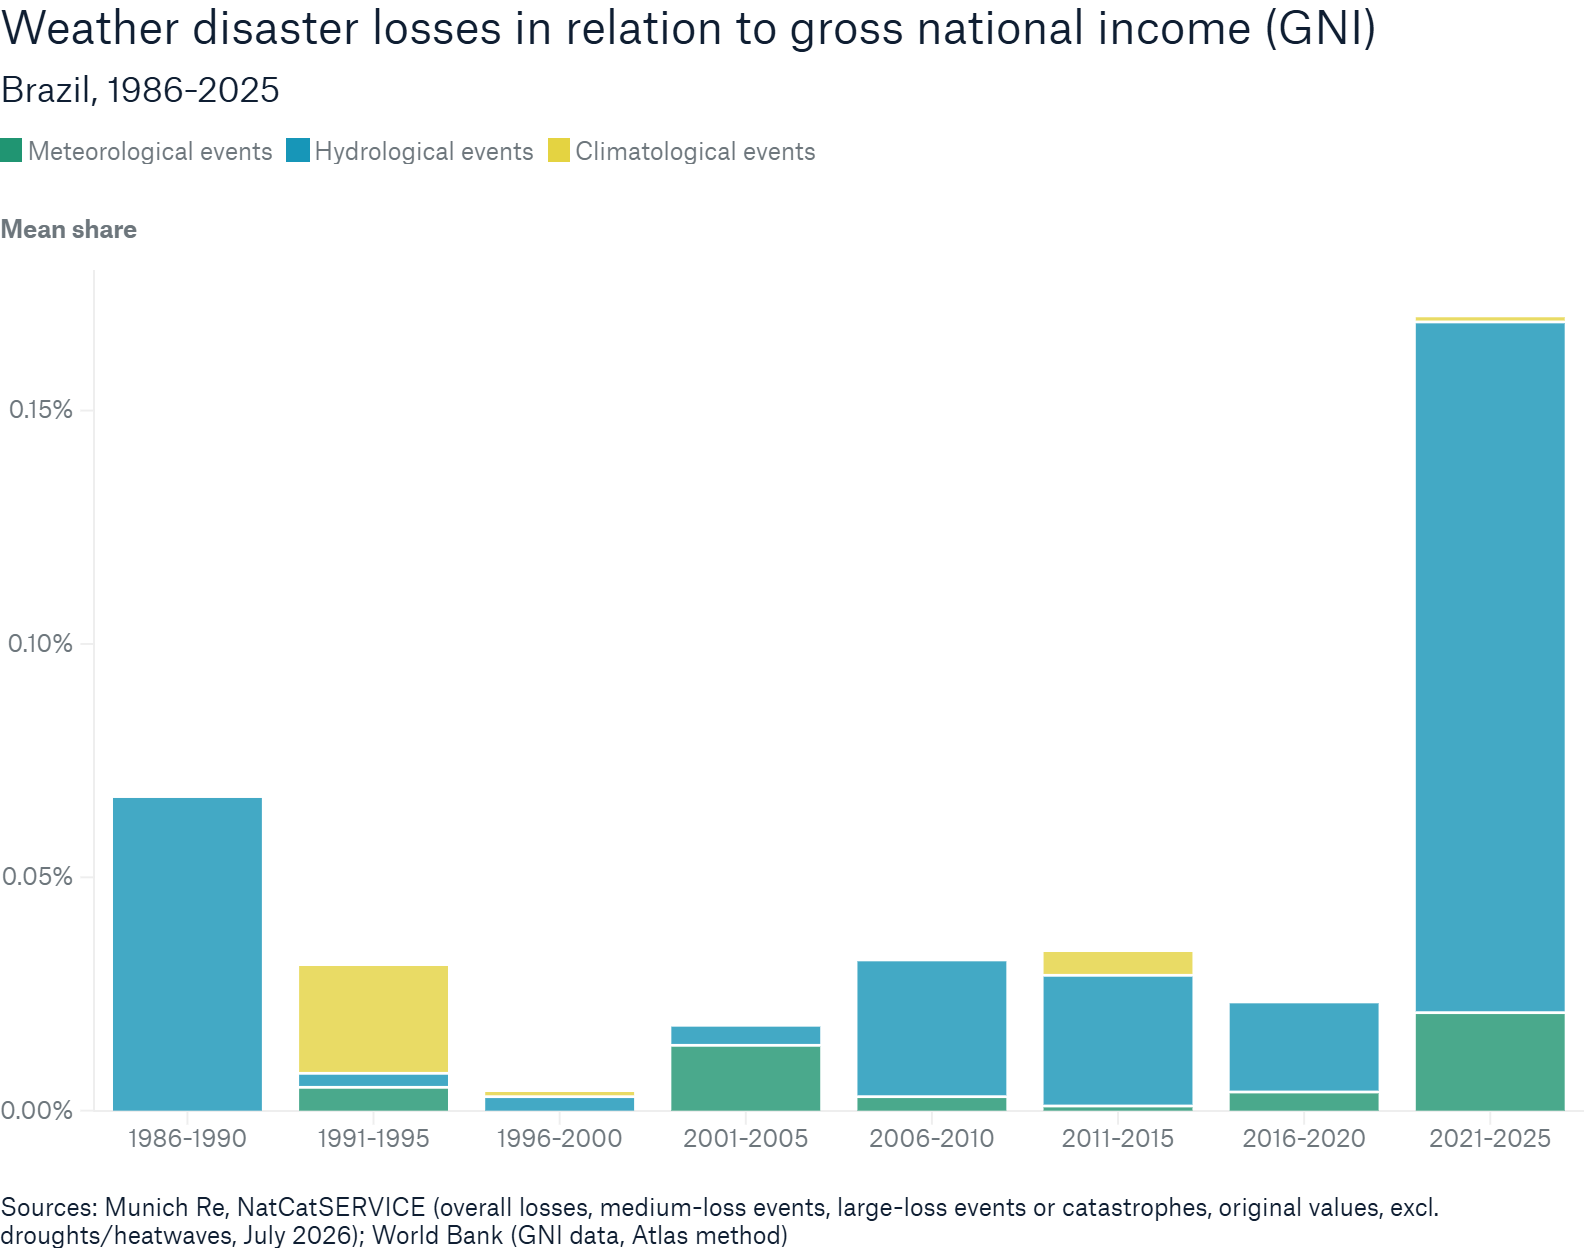
Brazil recorded some of the lowest loss/GNI ratios among the countries analysed, before the ratio jumped to almost 0.2% in 2021–2025. This increase was driven largely by the catastrophic 2024 floods in Rio Grande do Sul, Brazil’s worst natural disaster in decades. Attribution research indicated that El Niño and climate change increased the likelihood and intensity of the rainfall.
Europe
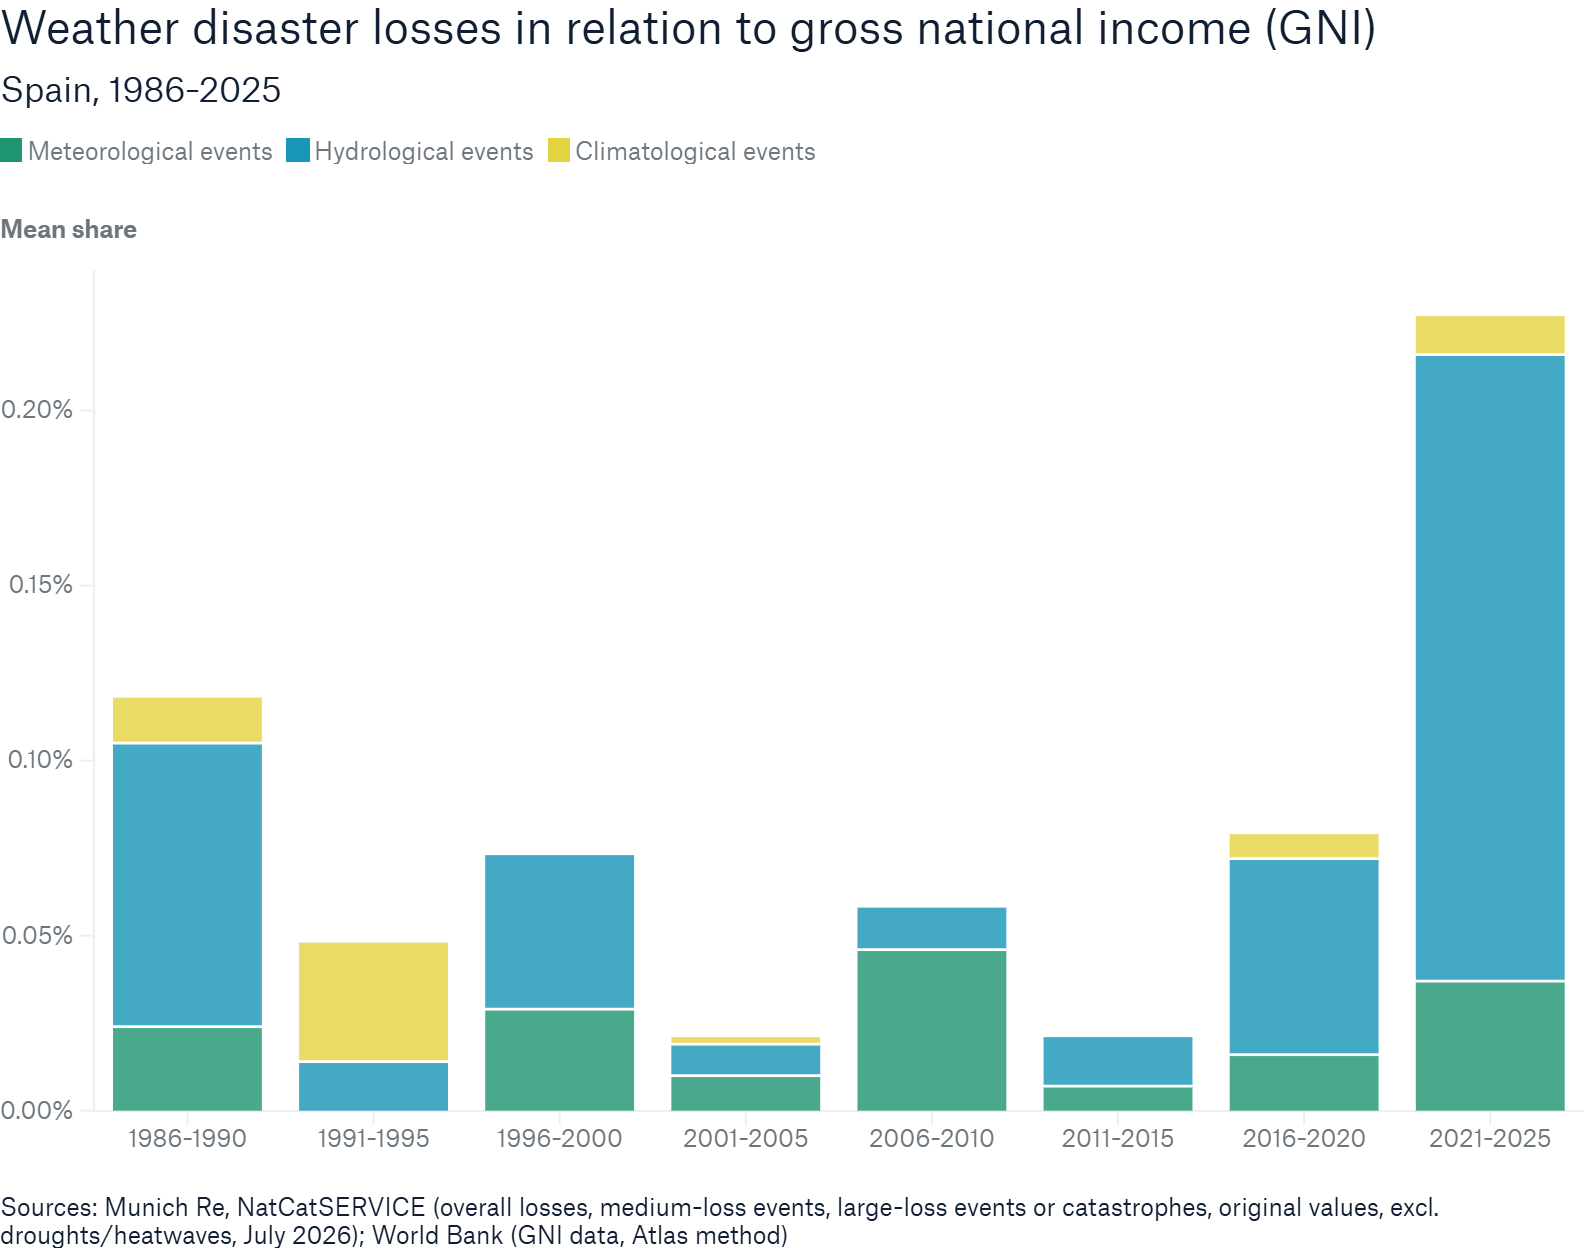
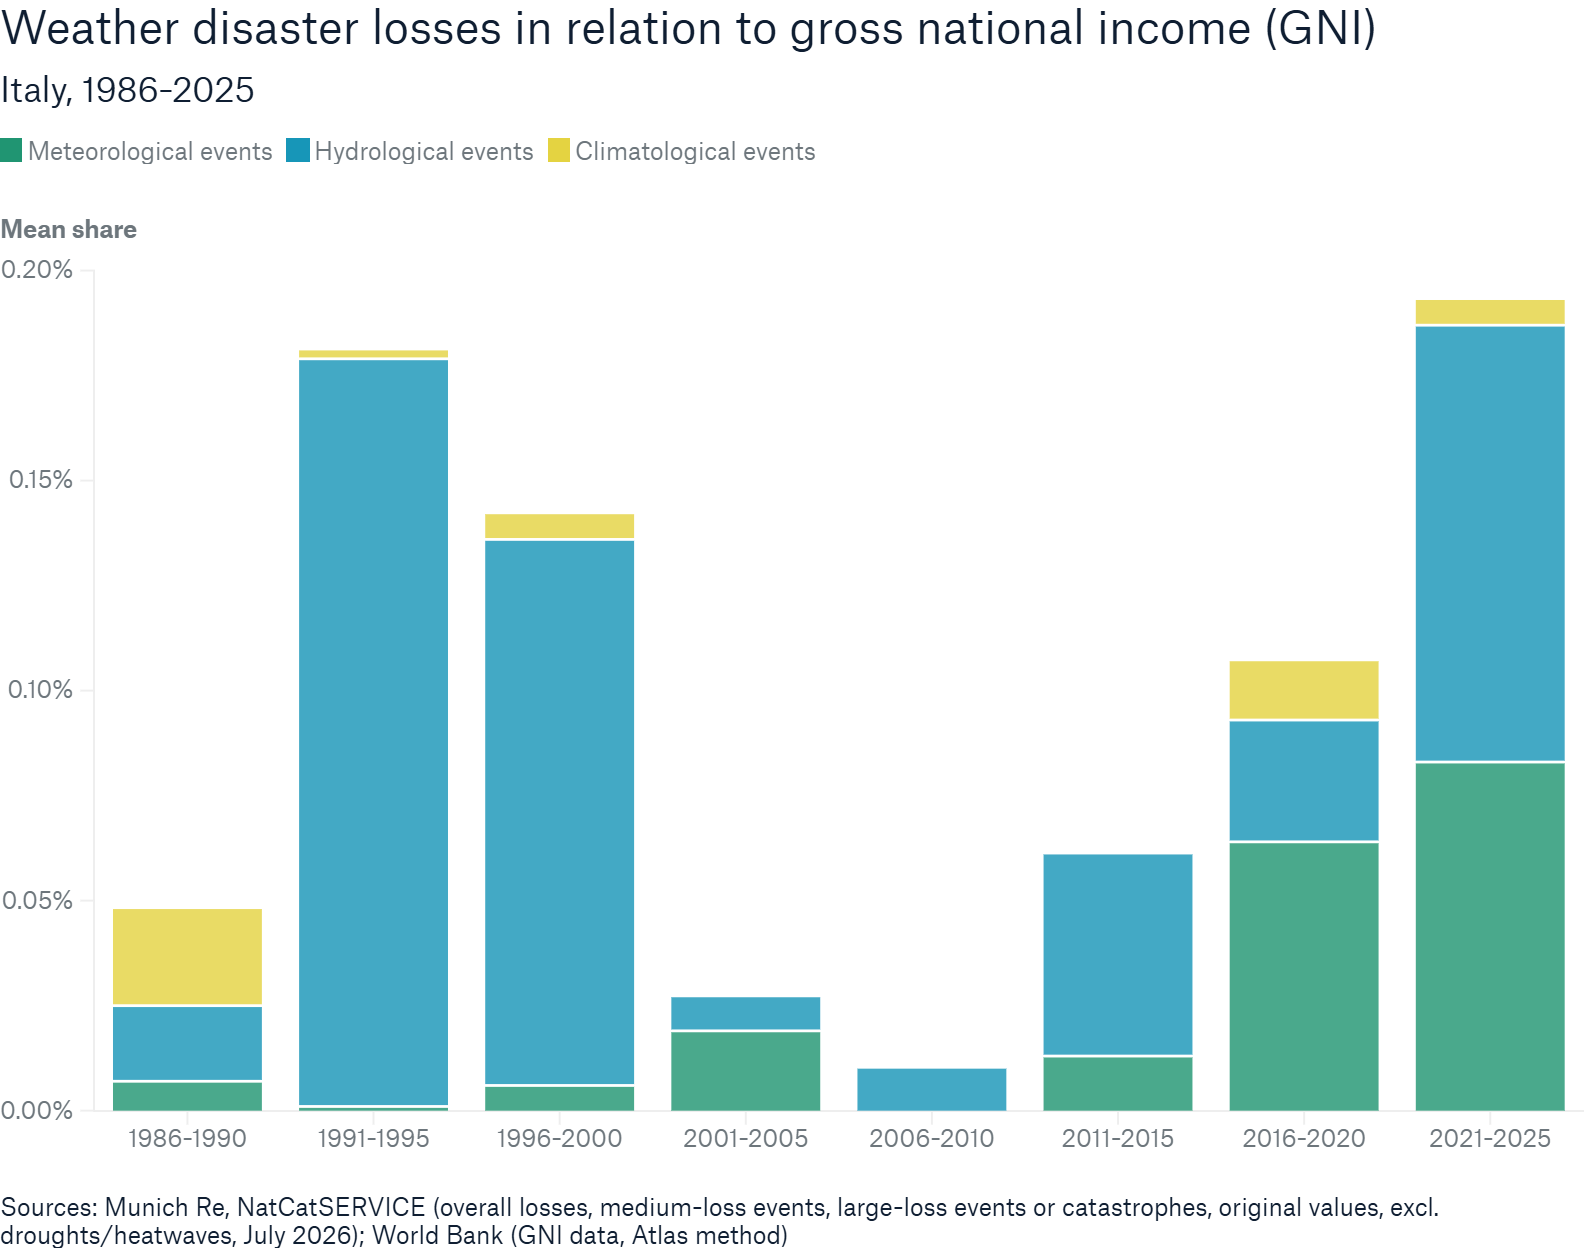
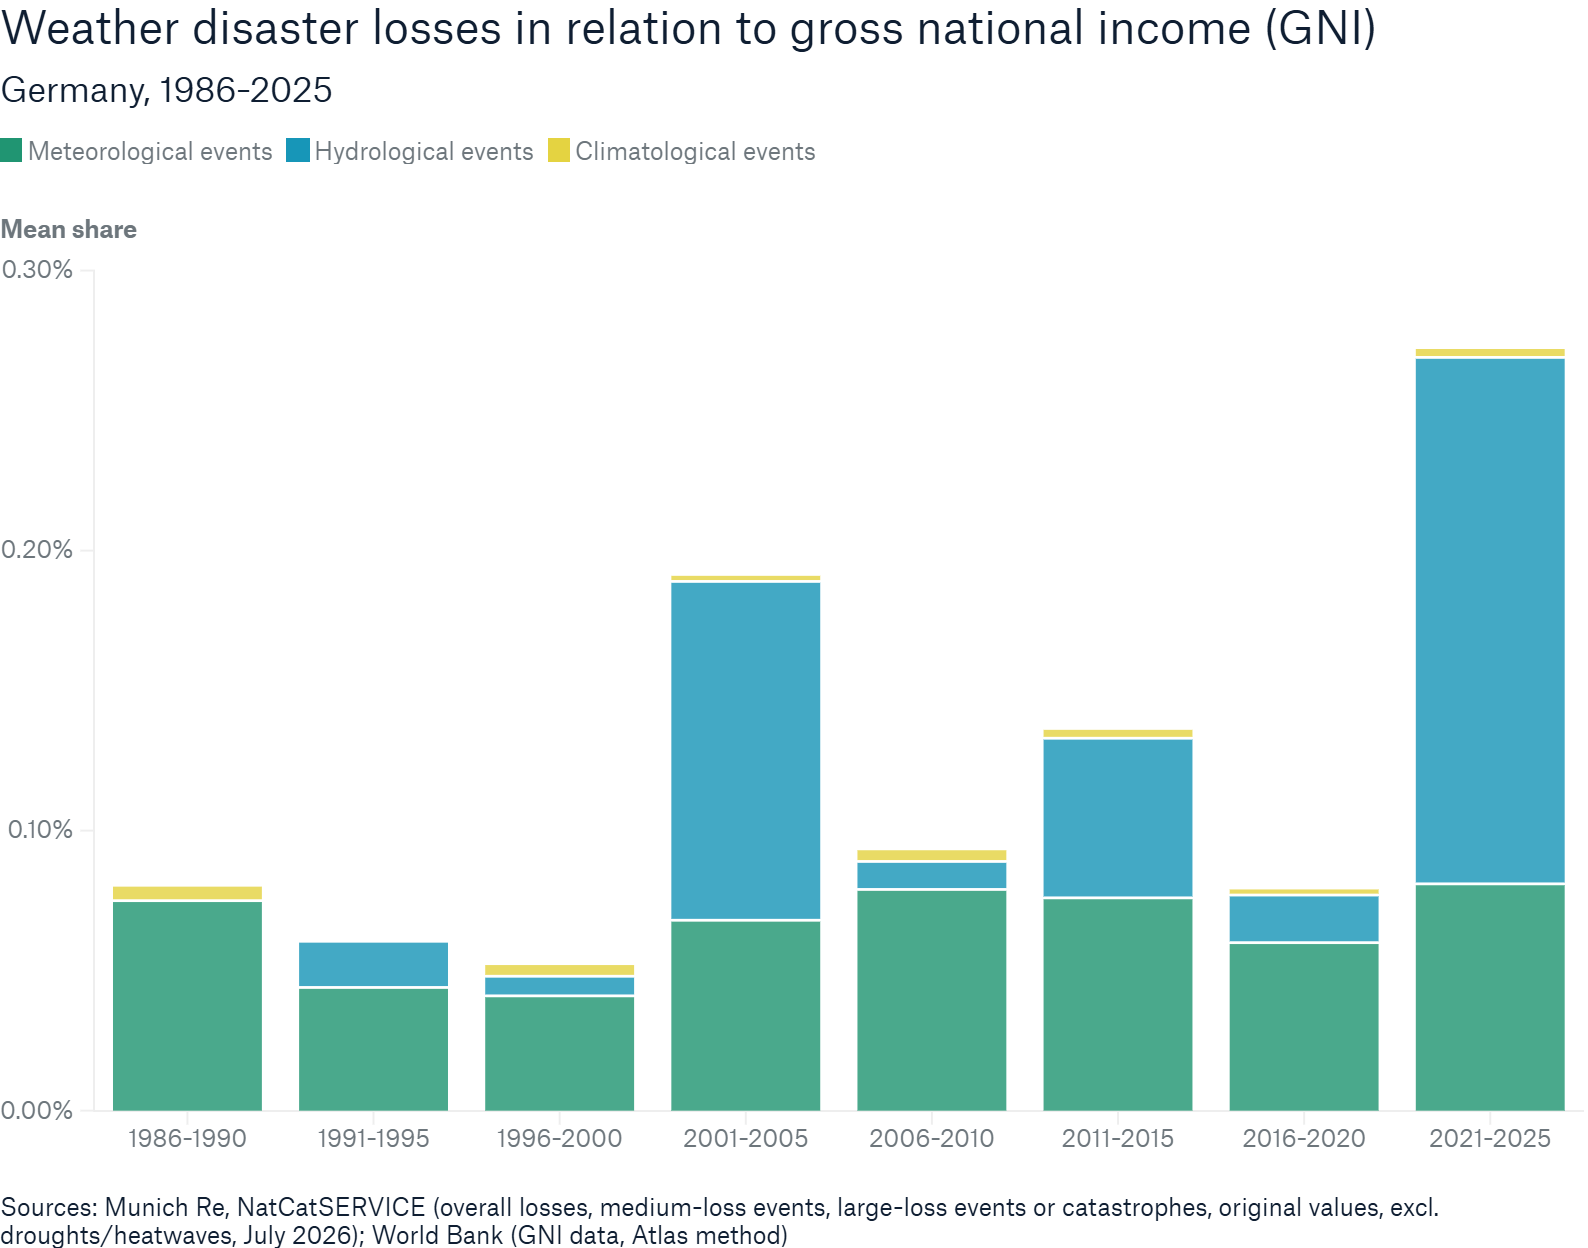
Spain, Italy and Germany each recorded their highest loss/GNI ratio in 2021–2025, meaning that weather disaster losses were at their largest in relation to national income compared with any other five-year period analysed. Spain’s ratio approximately tripled to more than 0.2% in that period, with hydrological losses accounting for almost four-fifths of the total. The 2024 Valencia flash floods were a major contributor here. Italy’s average ratio rose steadily from the 2006–2010 period onwards, mainly driven by severe convective storms and floods. Germany’s latest five-year ratio almost reached 0.3%. This was largely driven by the Ahr Valley disaster, which was part of the wider 2021 Central and Western Europe floods, the second-costliest flood disaster worldwide to date.
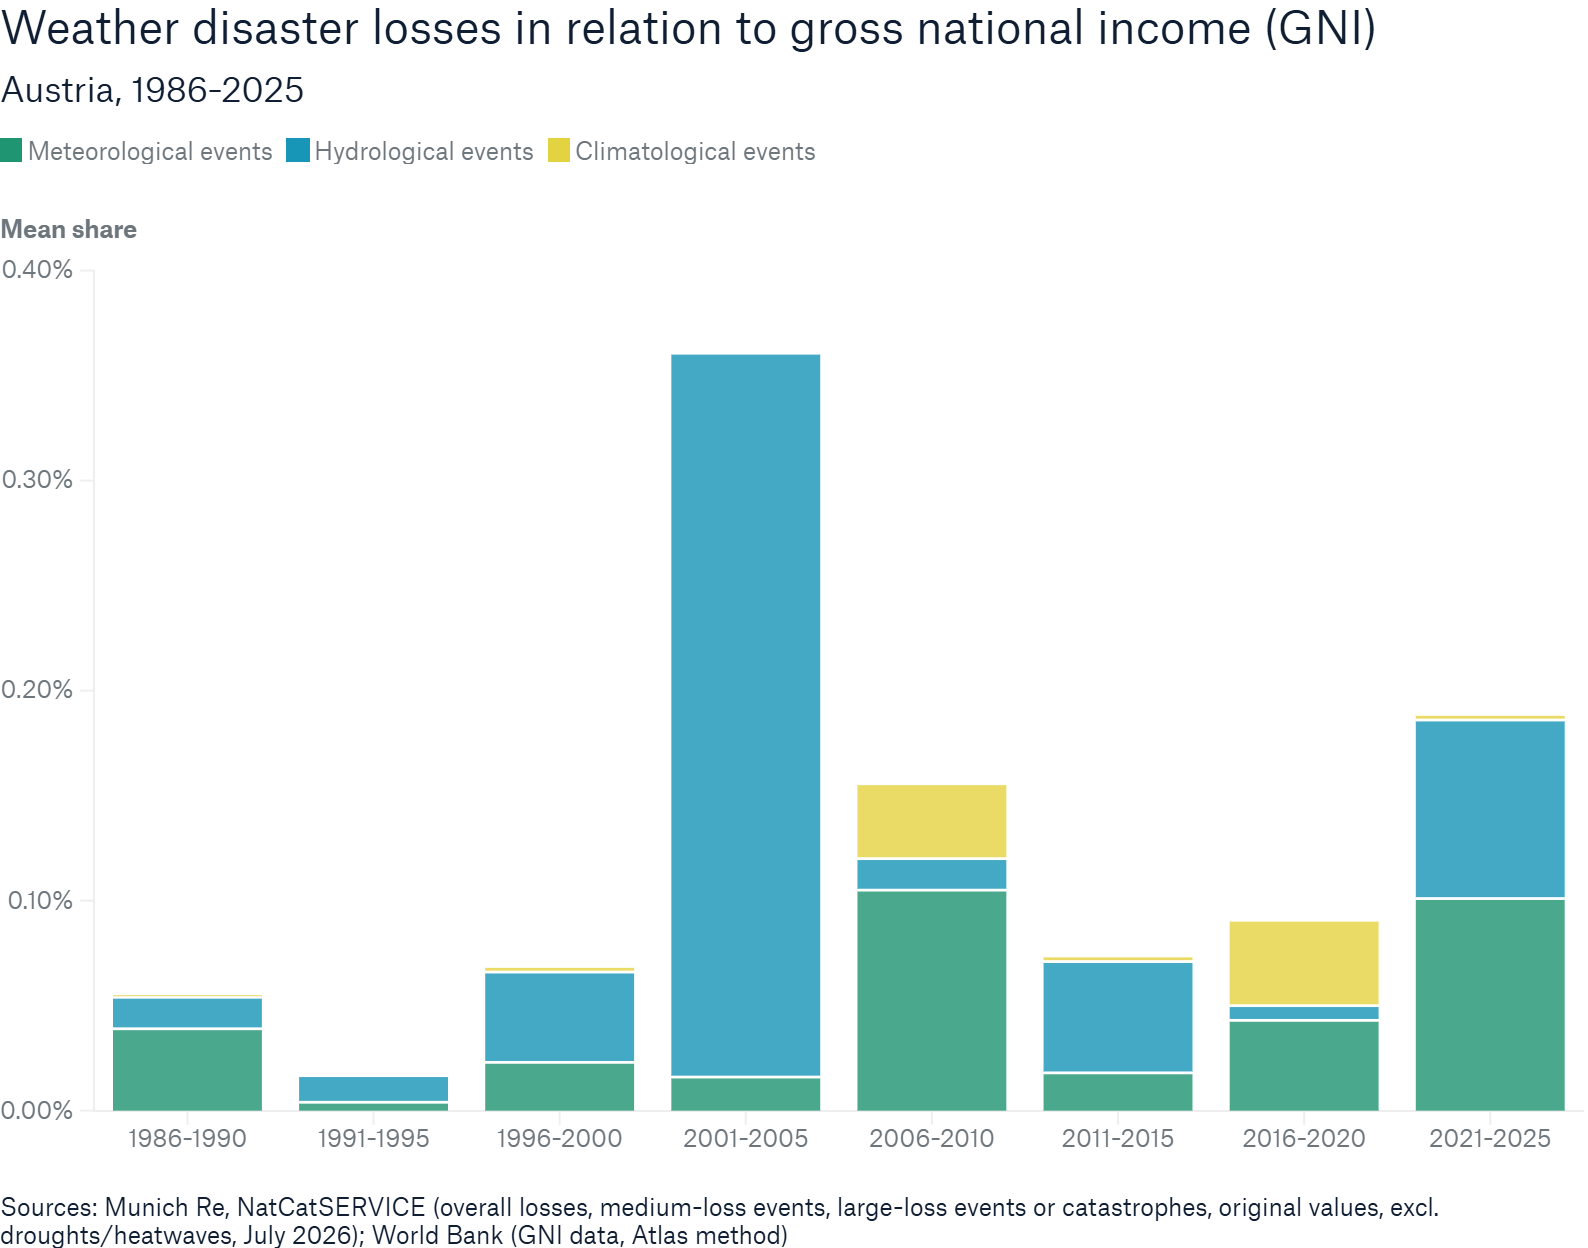
In other selected European countries, higher nominal GNI has moderated the loss/GNI ratios despite substantial disaster losses. In Austria, the historic floods of 2002 still stand out as the country’s long-term loss record, lifting the average annual loss burden to a peak of almost 0.4% of GNI in 2001–2005. While average losses reached even higher levels in 2021–2025, they accounted for a smaller share of an average national income that had more than doubled in the meantime.
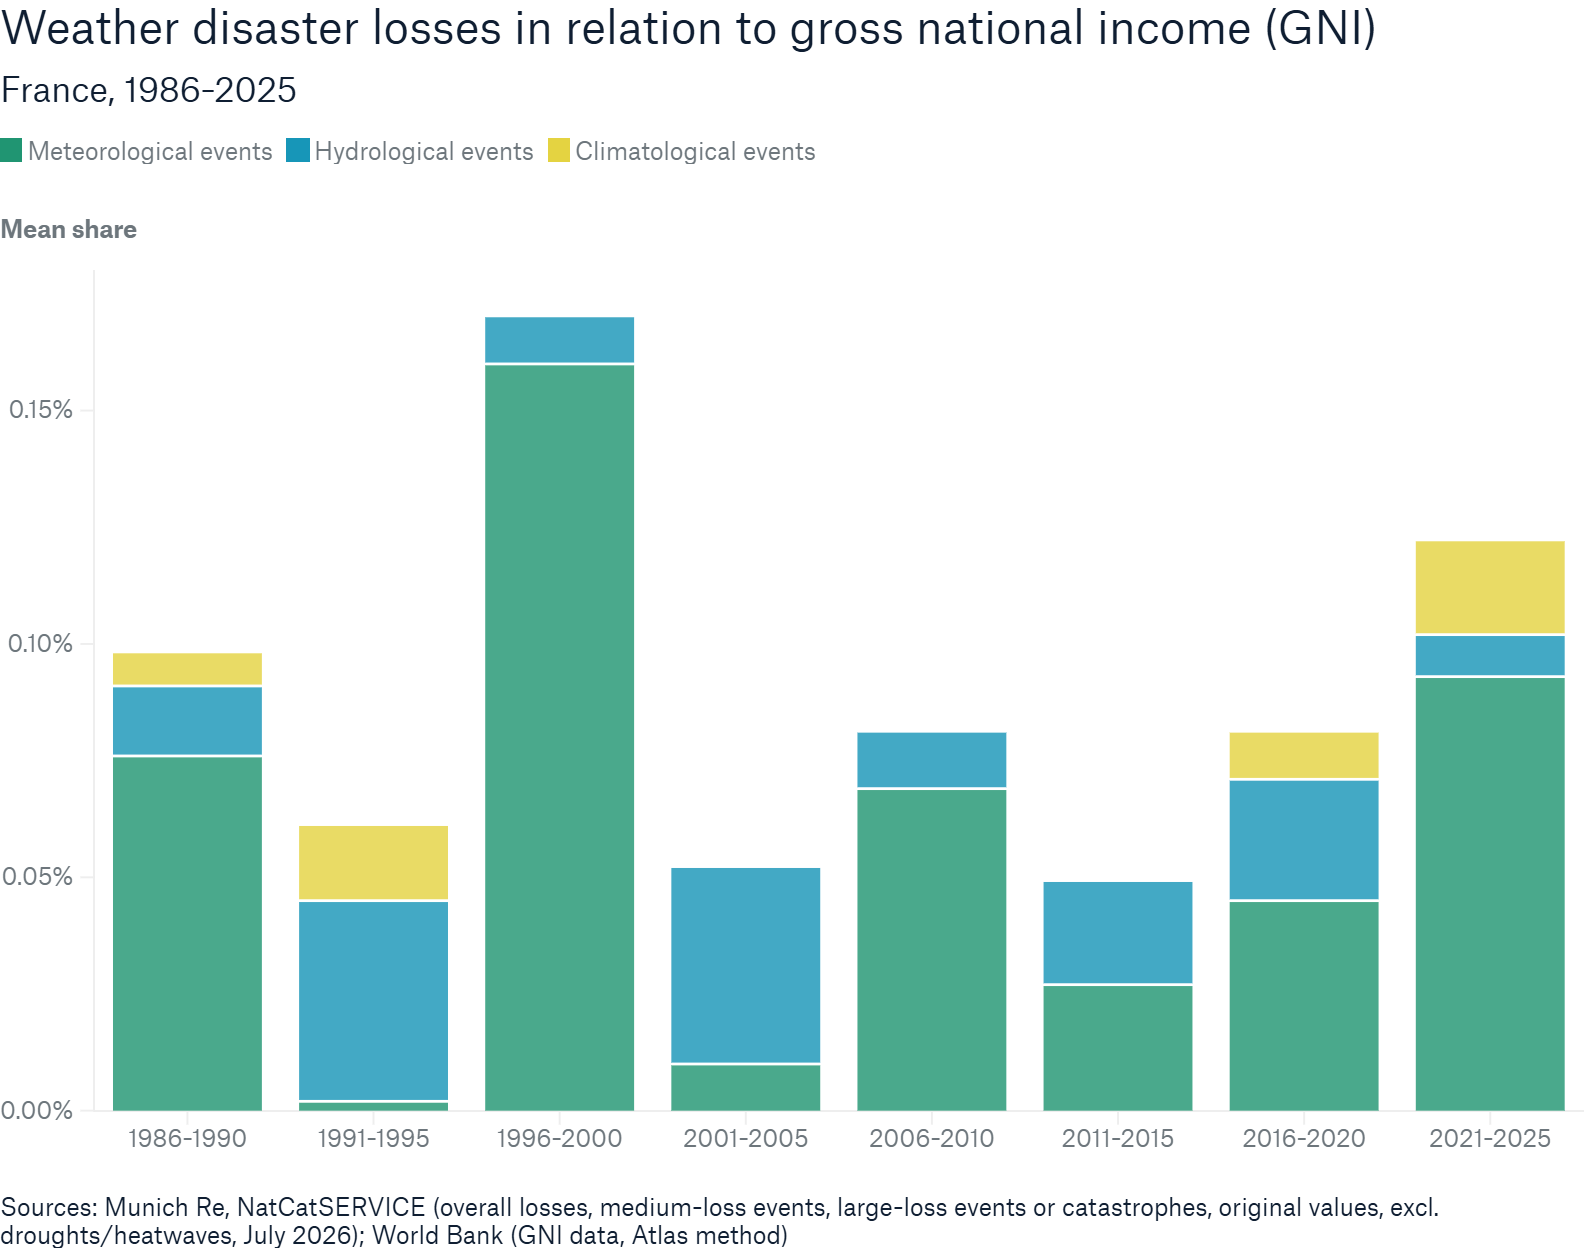


France’s loss burden reached its highest level in 1996–2000, largely reflecting the severe losses caused by winter storms Lothar and Martin. Although losses increased between 2011–2015 and 2021–2025, GNI kept the relative loss burden below the 1996–2000 record level. Portugal stands apart from the other countries in the comparison because wildfires dominate its long-term loss record. Severe fire years contributed to two pronounced peaks, with annual losses reaching on average almost 0.3% of GNI in 2001–2005 and in 2016–2020.
Türkiye, host of COP 31, saw a declining average annual loss share of GNI from its 1996–2000 peak, although it remained above the level recorded at the start of the analysis. The costliest weather disaster to date was a cold wave in 2025. Like New Zealand, Türkiye is also extremely prone to earthquakes. As the figures in this analysis concentrate on weather-related perils, they do not capture Türkiye’s total natural disaster burden.
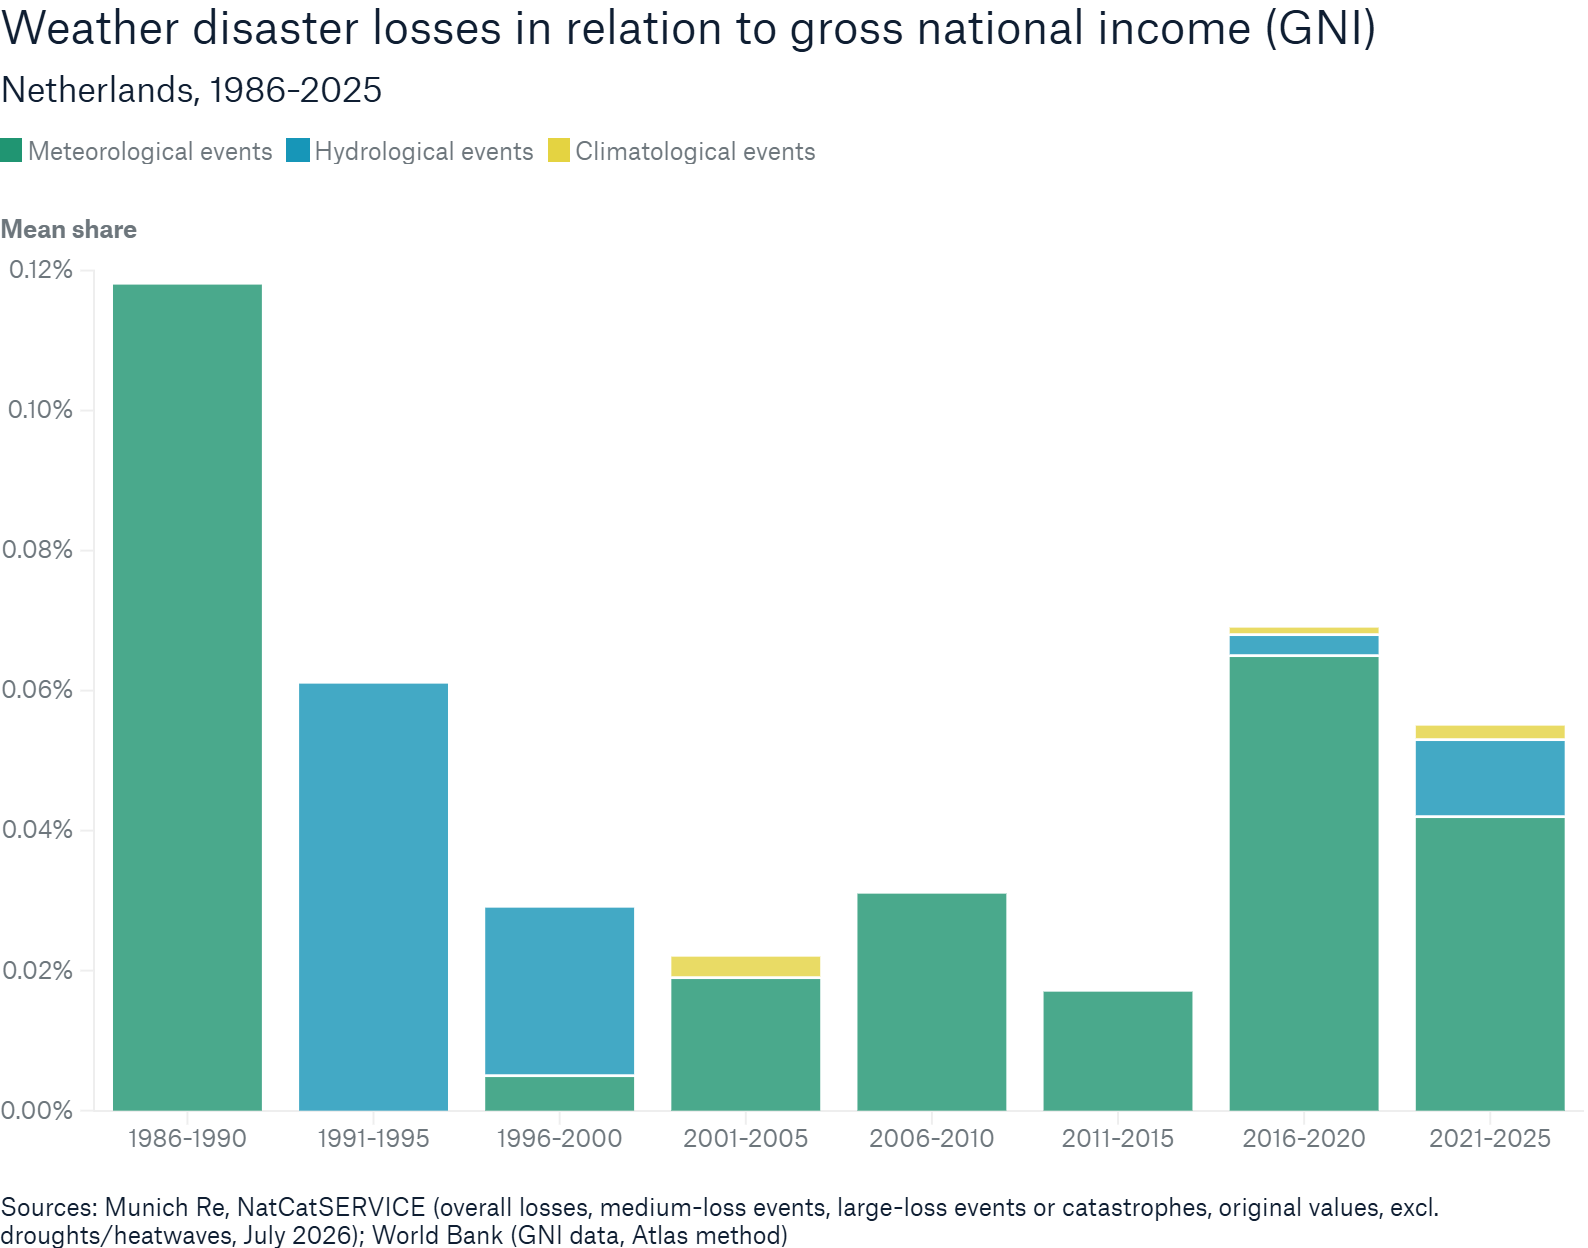
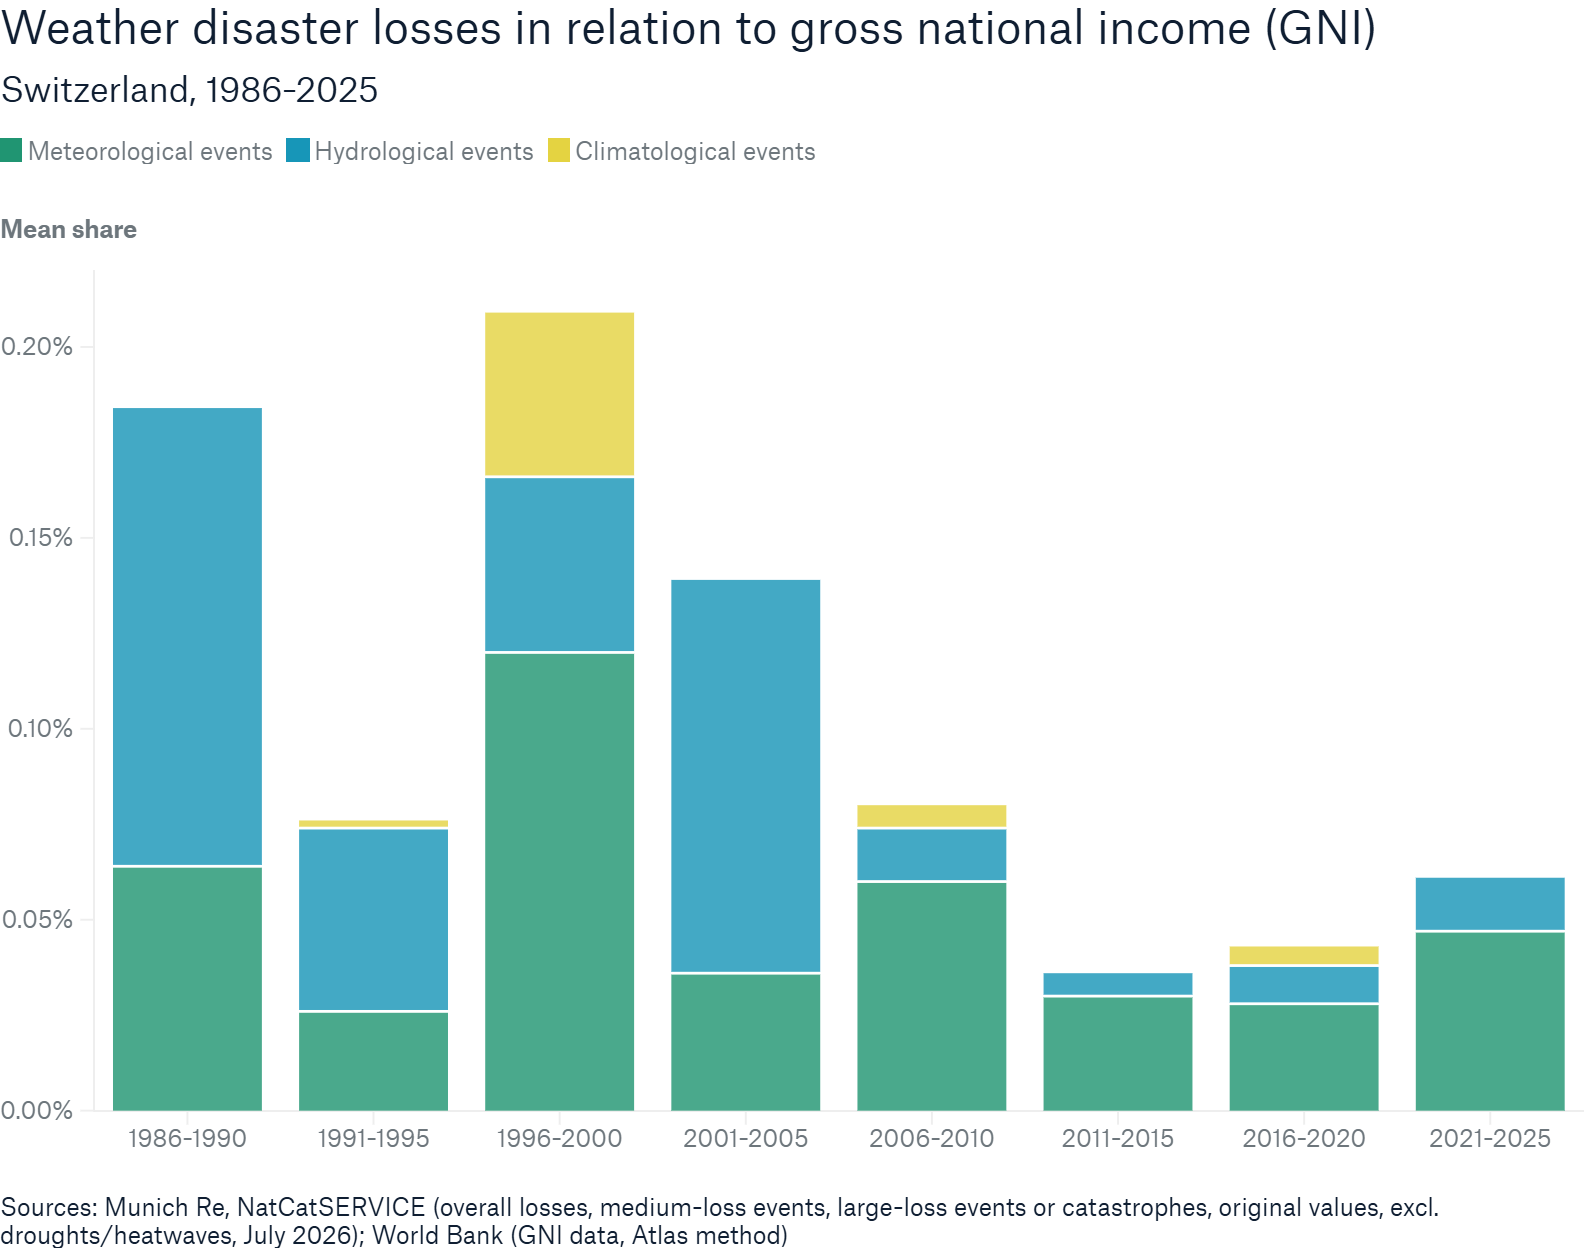
The Netherlands, Switzerland and the UK experienced a similar pattern: fluctuating average weather-related losses do not necessarily mean that the loss/GNI ratios always change in the same way. As the average national incomes increased over time, some periods with higher average losses even showed comparatively lower loss/GNI ratios. In the UK, for example, average annual losses were higher in 2006–2010 than in 1986–1990, but the average loss/GNI ratio was lower (0.1 vs. 0.2%), as GNI was substantially higher.
Asia/Pacific
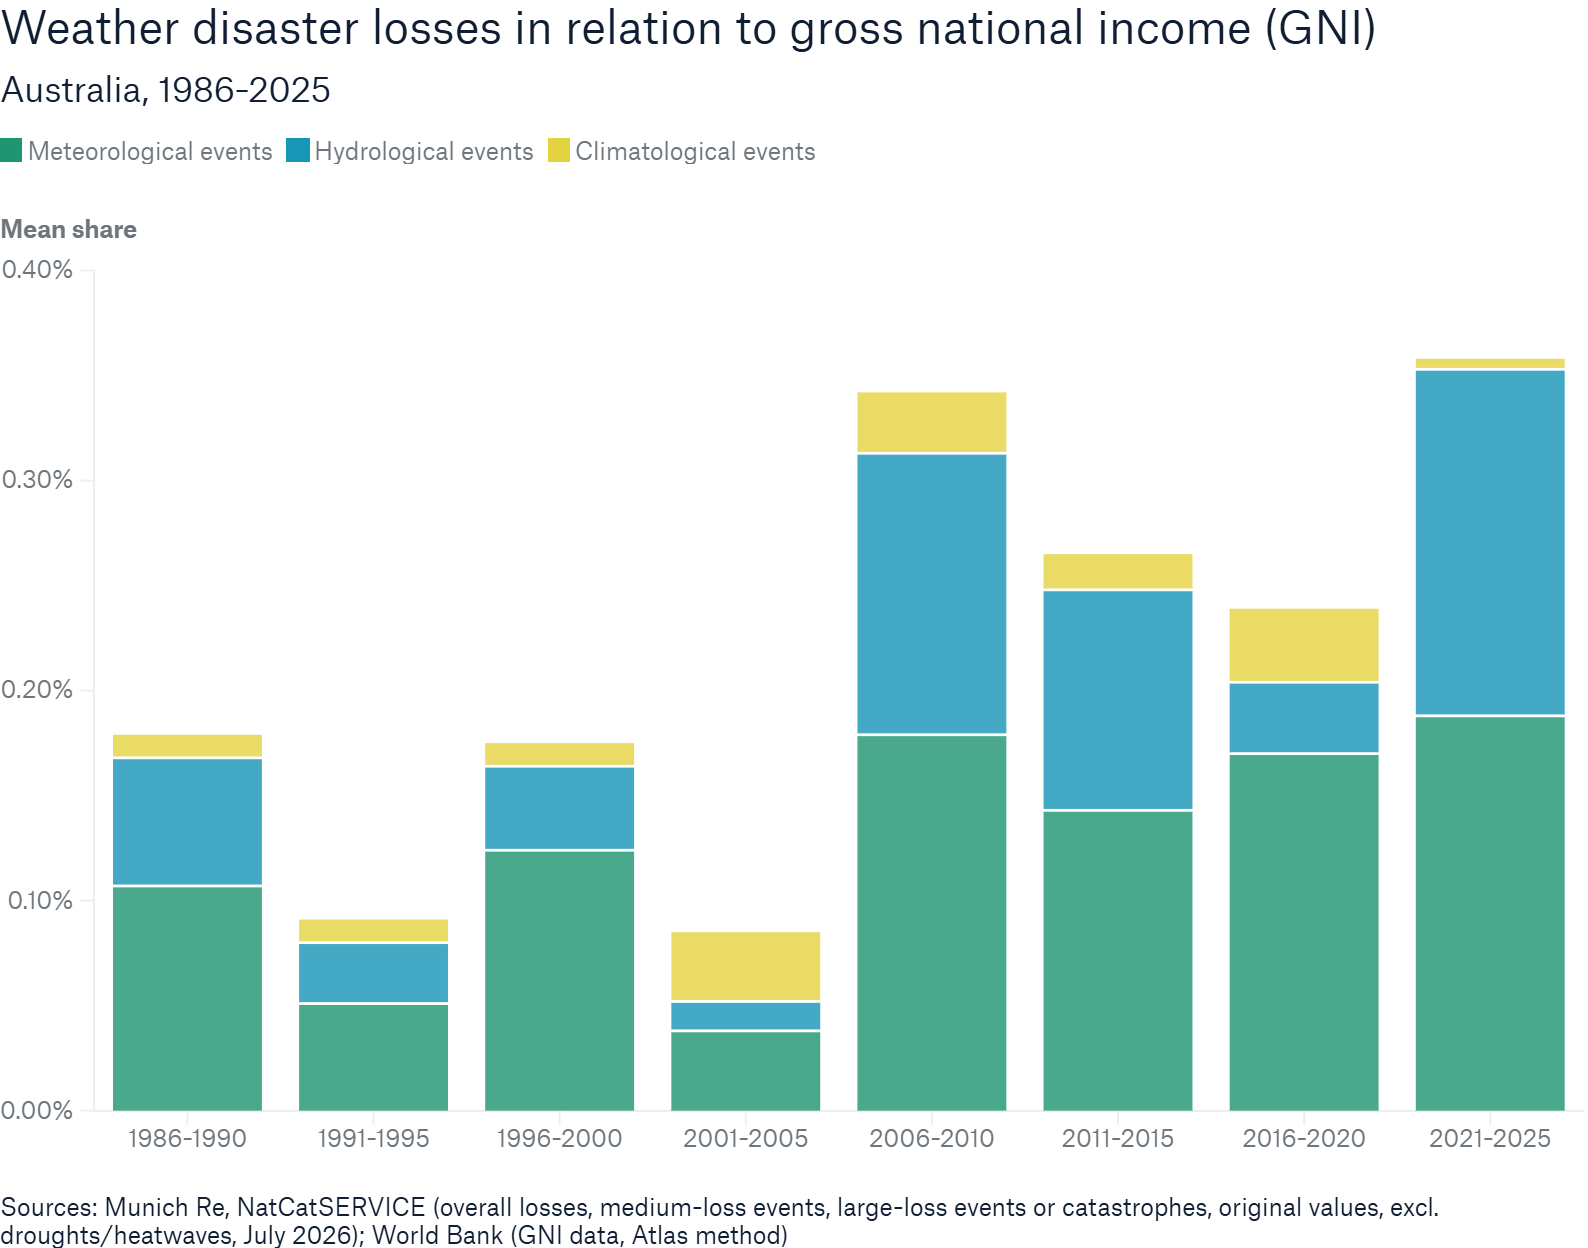
Australia and New Zealand have both experienced a marked increase in weather-related losses relative to GNI in recent years.
In Australia, the latest five-year period (2021–2025) recorded the highest loss burden of the past four decades, surpassing the previous peak associated with the Queensland flooding that began in late 2010. The major 2022 flood in eastern Australia and severe convective storms were the main drivers in the 2021–2025 period, pushing the loss/GNI ratio even higher than the already elevated level since the 2006–2010 period.
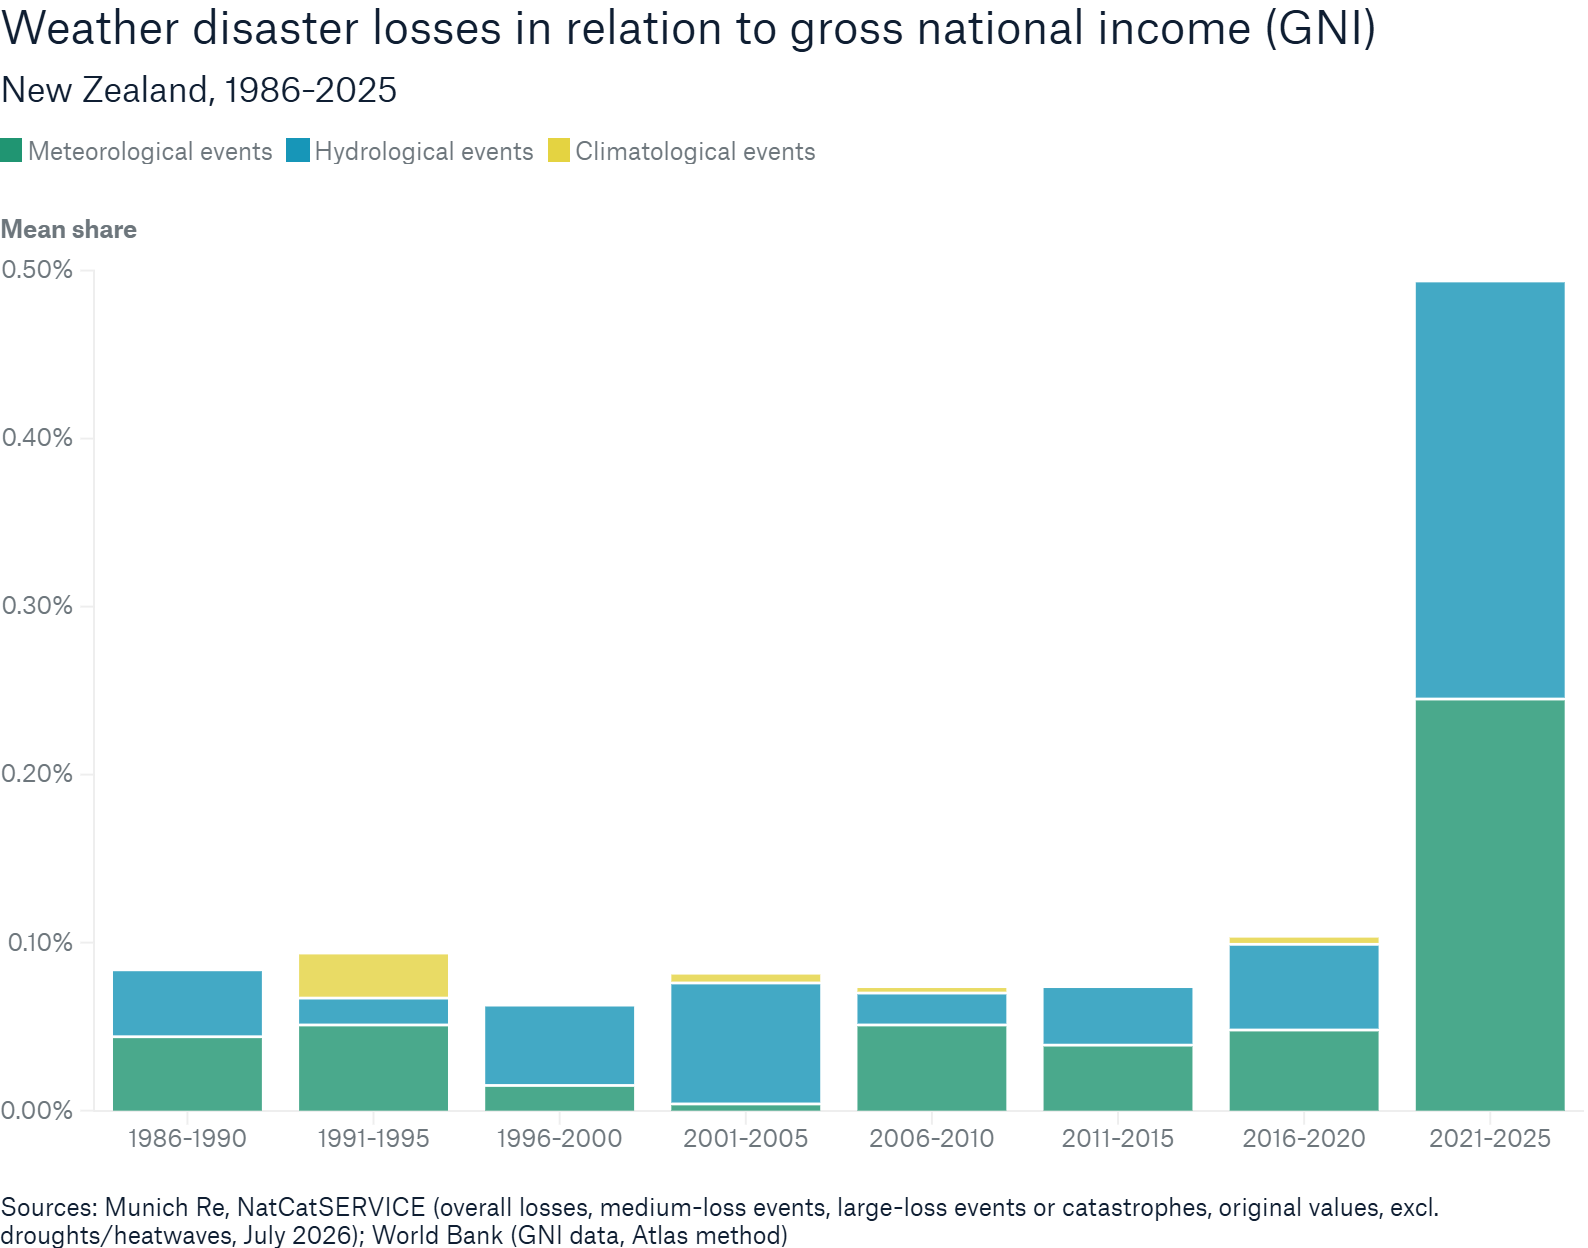
New Zealand shows an even more pronounced shift. Following several decades of relatively stable modest weather-related losses, the loss/GNI ratio almost quintupled in the 2021–2025 period compared to the previous five-year mean. The Auckland floods and Cyclone Gabrielle in 2023 played a central role in this increase. Although earthquakes (which were not in the scope of this analysis) remain the country’s dominant catastrophe risk by far, recent years demonstrate that weather-related disasters can also generate substantial economic losses relative to the national income.
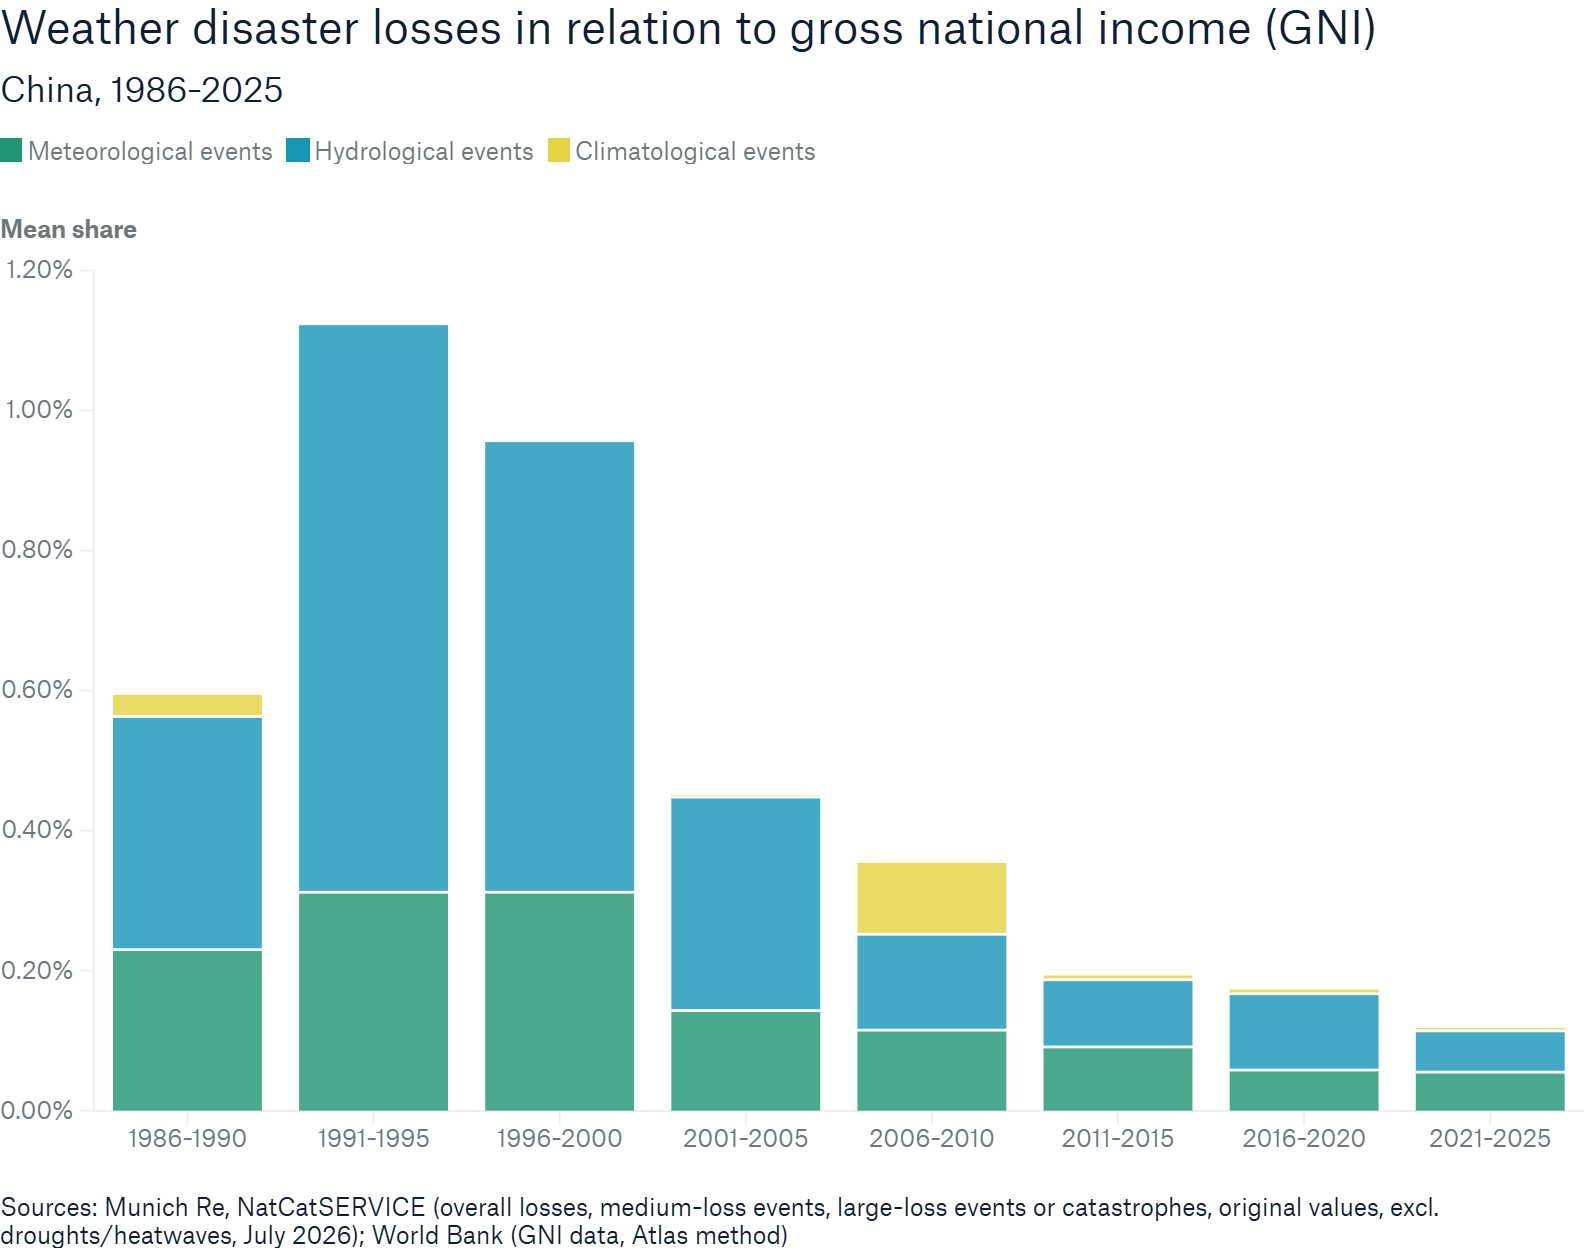
China recorded one of the highest historical loss/GNI burdens of the countries analysed, peaking at around 1.1% in 1991–1995. The ratio subsequently declined, particularly after 2001, mainly reflecting the rapid growth of the Chinese national income. Strong GNI growth contributed to reduced loss/GNI ratios. China has also invested heavily in flood prevention to reduce substantial exposure along major river systems running through densely populated urban and economic centres. These investments in flood protection and disaster preparedness may also have helped contain the relative economic burden of weather disaster losses.
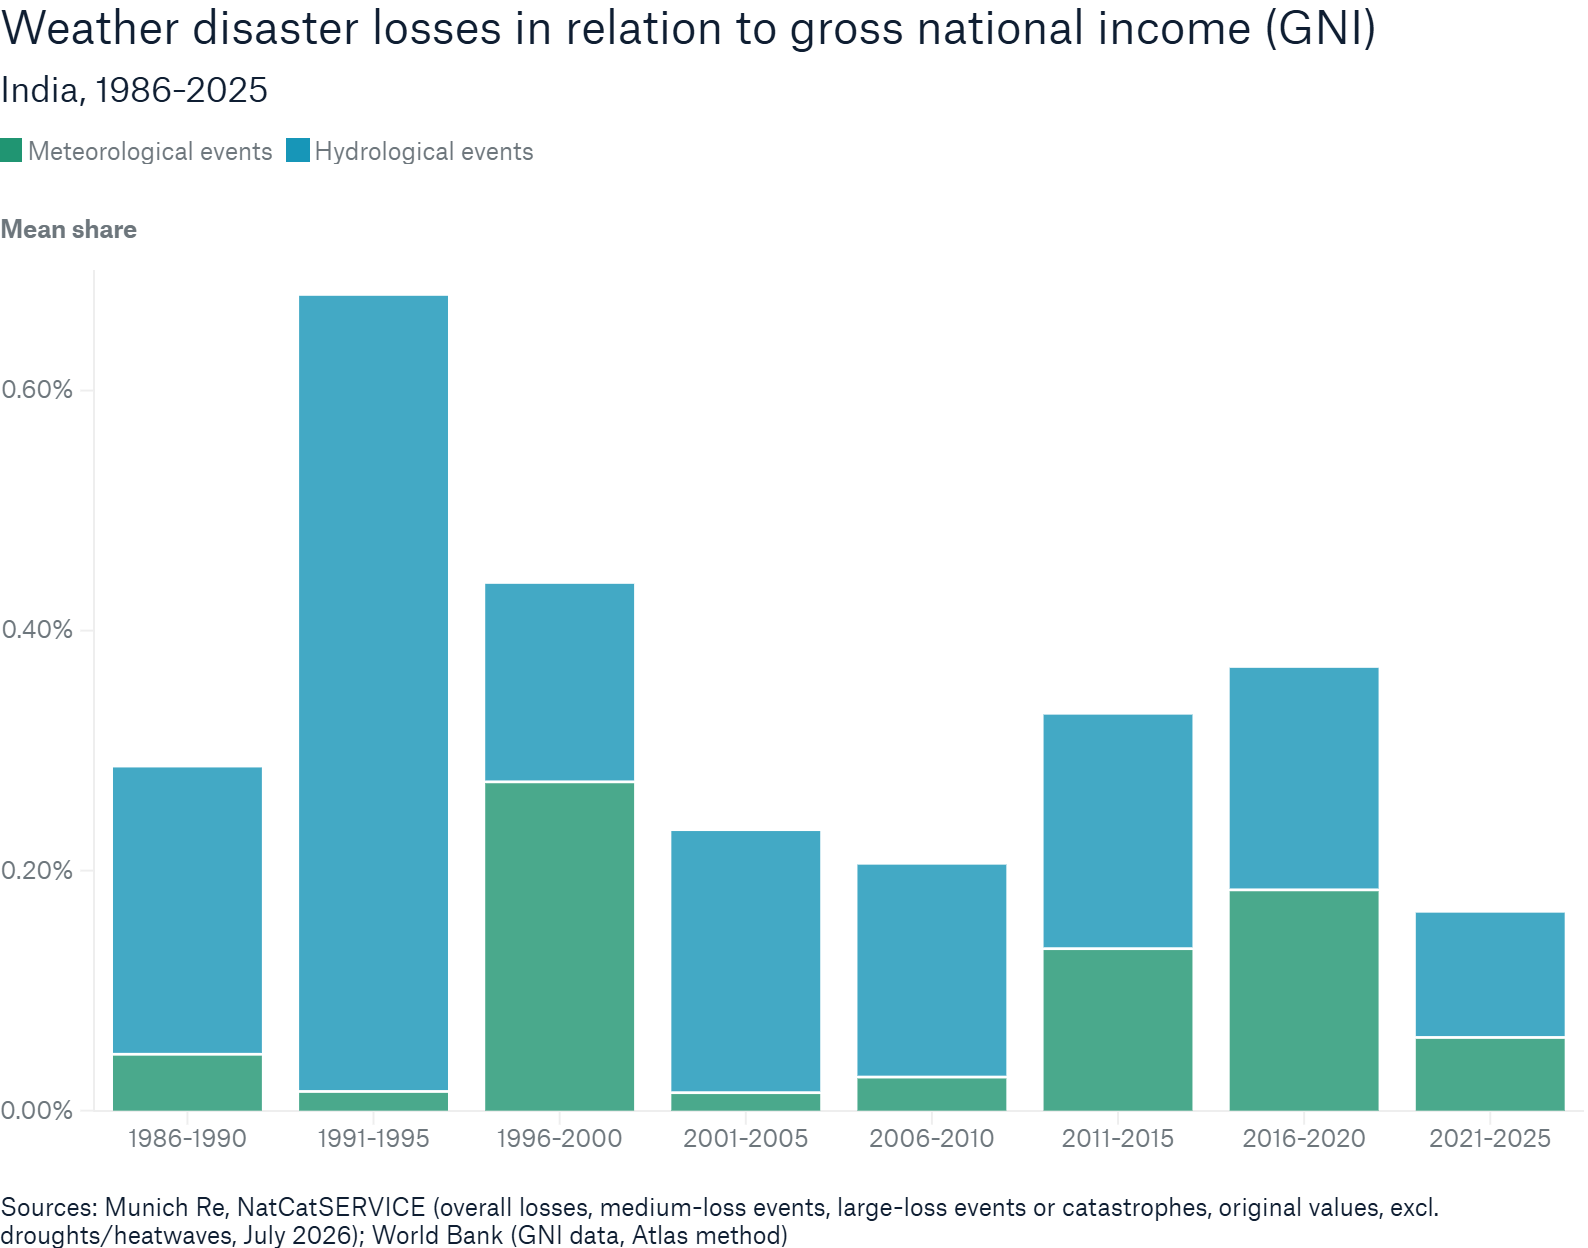
Like China, India shows a comparatively high historical relative loss burden, peaking in 1991–1995, driven by high annual average flood losses. Although several cyclones and floods, including the Kerala floods and Cyclone Amphan, drove renewed loss peaks between 2011 and 2020, the average loss/GNI ratio was again lower in the last five-year period. Unlike China, India’s decrease between the two latest periods reflects both higher nominal GNI and significantly lower average annual losses. Nevertheless, the series remains event-driven. Future losses may also be affected by changing exposure and weather hazards, which this analysis does not measure separately.
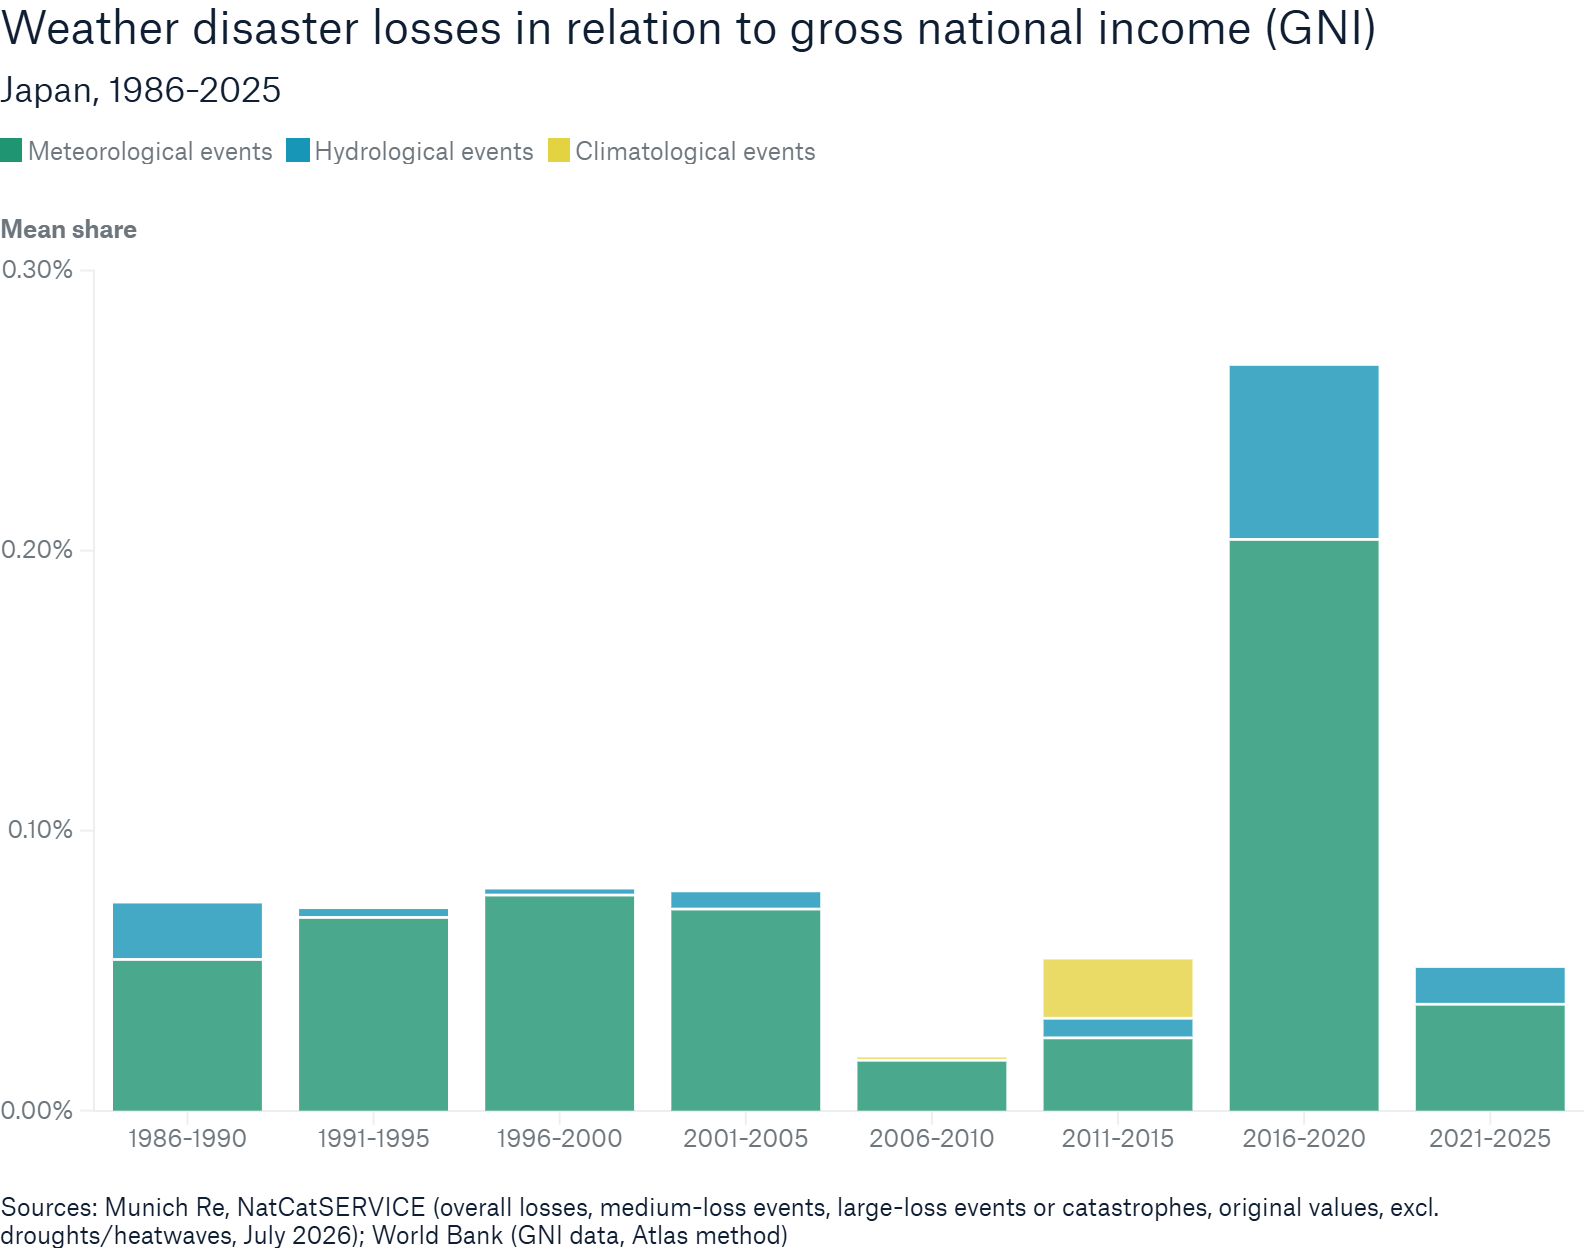
Japan’s weather-related loss/GNI burden is generally low, apart from a pronounced peak of almost 0.3% in the 2016–2020 period, which was mainly driven by several disastrous typhoons hitting the country in 2018 and 2019. Therefore, meteorological events constituted the largest share of that result. Japan’s proven preparedness and investment in protection are particularly relevant given that it is one of the world’s most disaster-prone countries, exposed to both extreme weather and earthquake risks. For context, the 2011 earthquake – one of the most devastating natural disasters on record and the cause of the Fukushima nuclear disaster – would have raised Japan’s loss/GNI ratio for 2011–2015 to 0.75% if earthquakes had been included in the analysis.
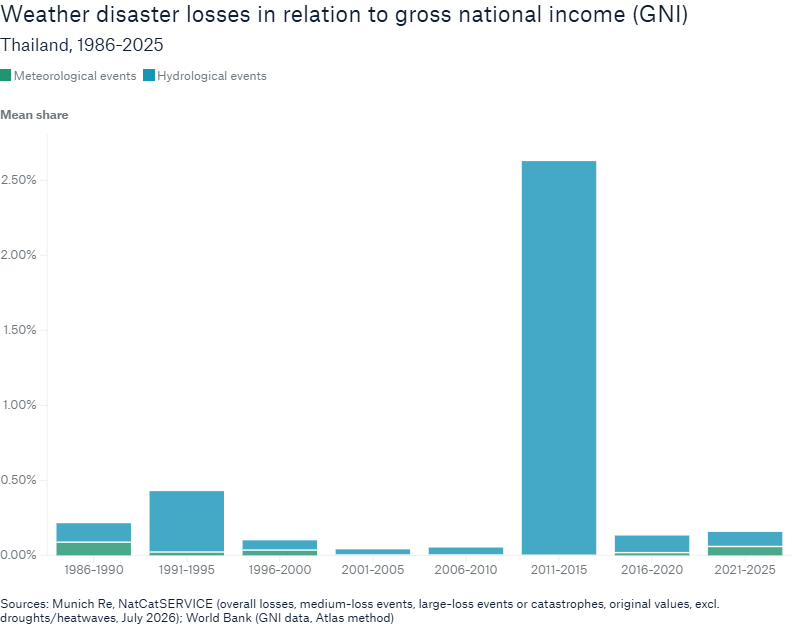
Thailand recorded relatively low ratios in most periods. An extreme outlier occurred in 2011–2015, driven overwhelmingly by hydrological events. They pushed the loss/GNI ratio to 2.6% – the highest annual average ratio among all countries and all five-year periods in the sample. The 2011 flood disaster in Thailand remains the costliest flood event ever.
Our experts